This page details the five most recent updates to the Baseball Savant page as our team pushes them to the live site, including new features, notable bugfixes, quality of life and visual improvements, and more.
To see an index of all changelog entries on record, click here.
There are two updates related to ABS challenges:
1: The ABS leaderboard has been updated with new run value stats, and also now shows how often players actually challenge the calls they can overturn -- aka, incorrect calls on challengeable pitches. (For a full explanation of the new metrics, see the top of the ABS leaderboard page.)
This allows you to see which players and teams take the most advantage of their available challenges, and which ones leave the most potential overturns on the table.
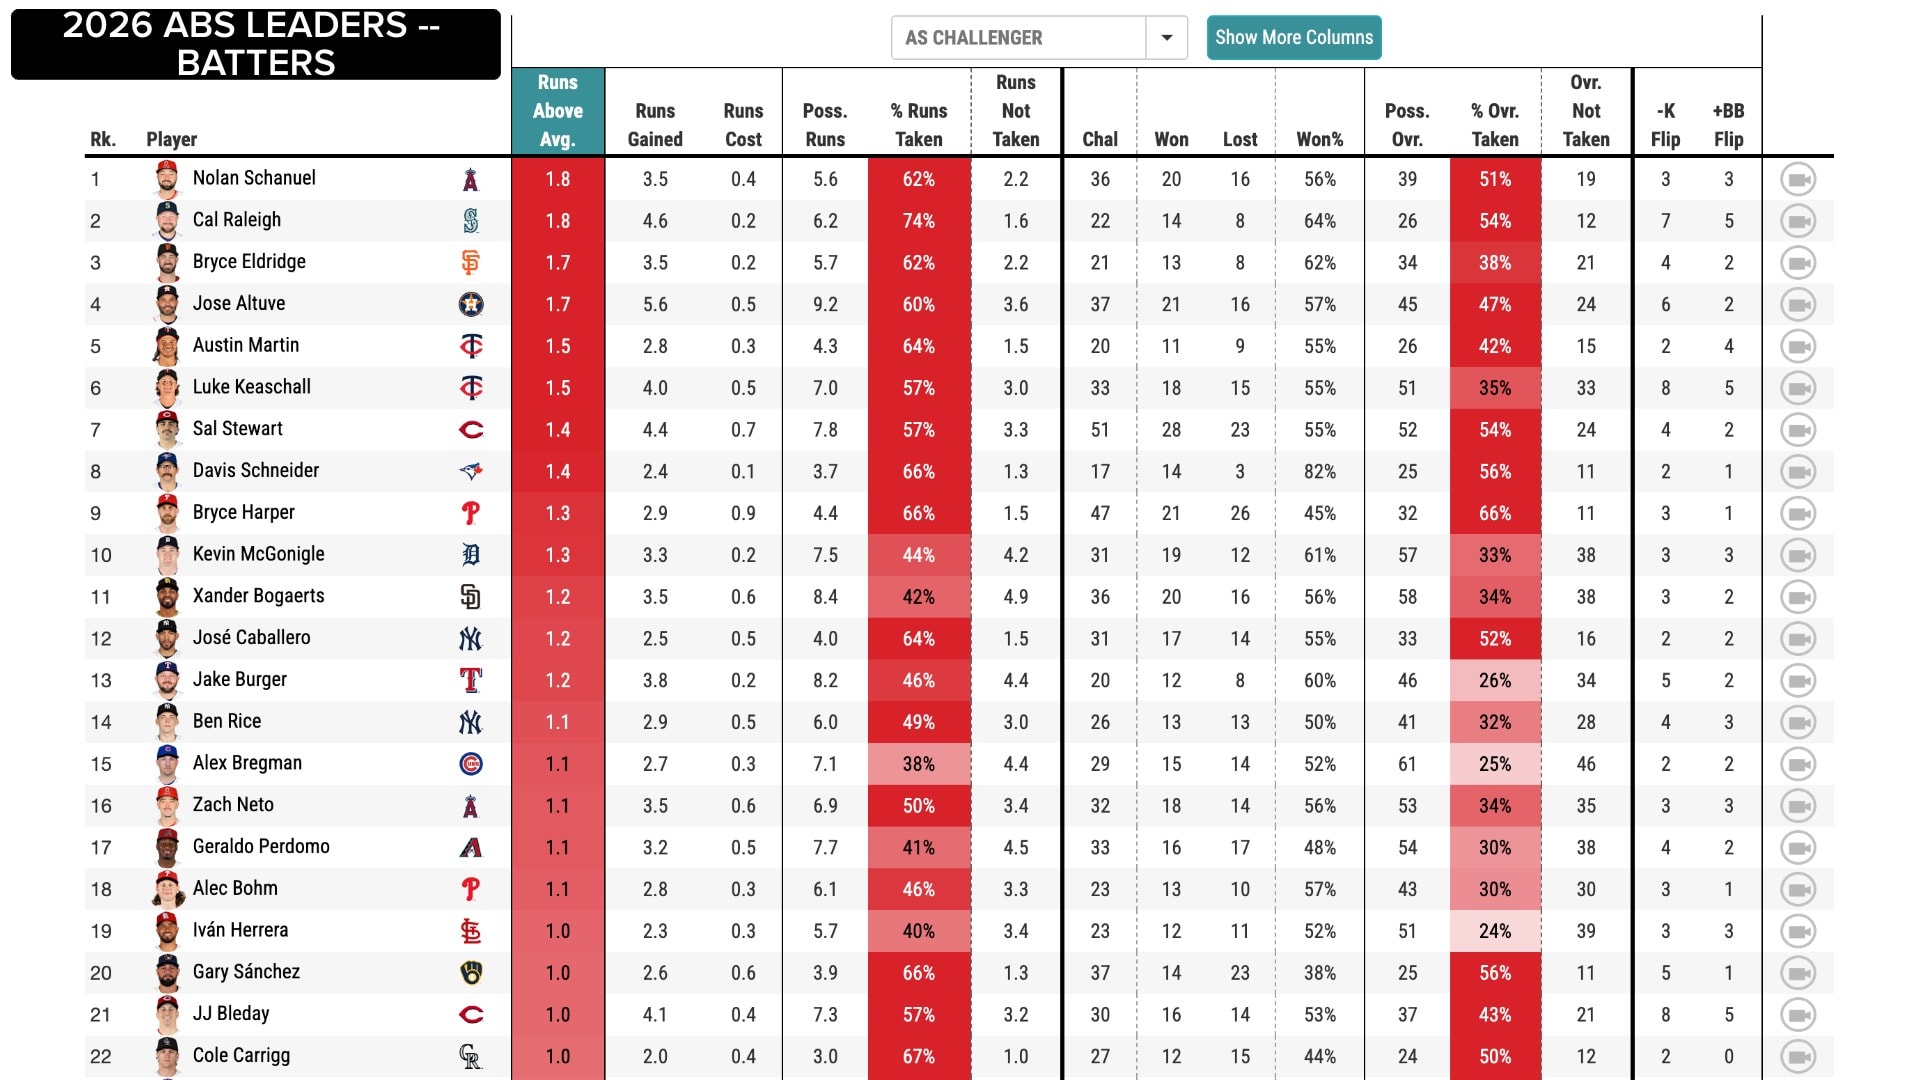
For example, as a batter, Bryce Harper successfully challenged 66% of his possible overturns during the 2026 season -- the highest of any hitter with at least 10 challenges. He was a very aggressive and valuable challenger.
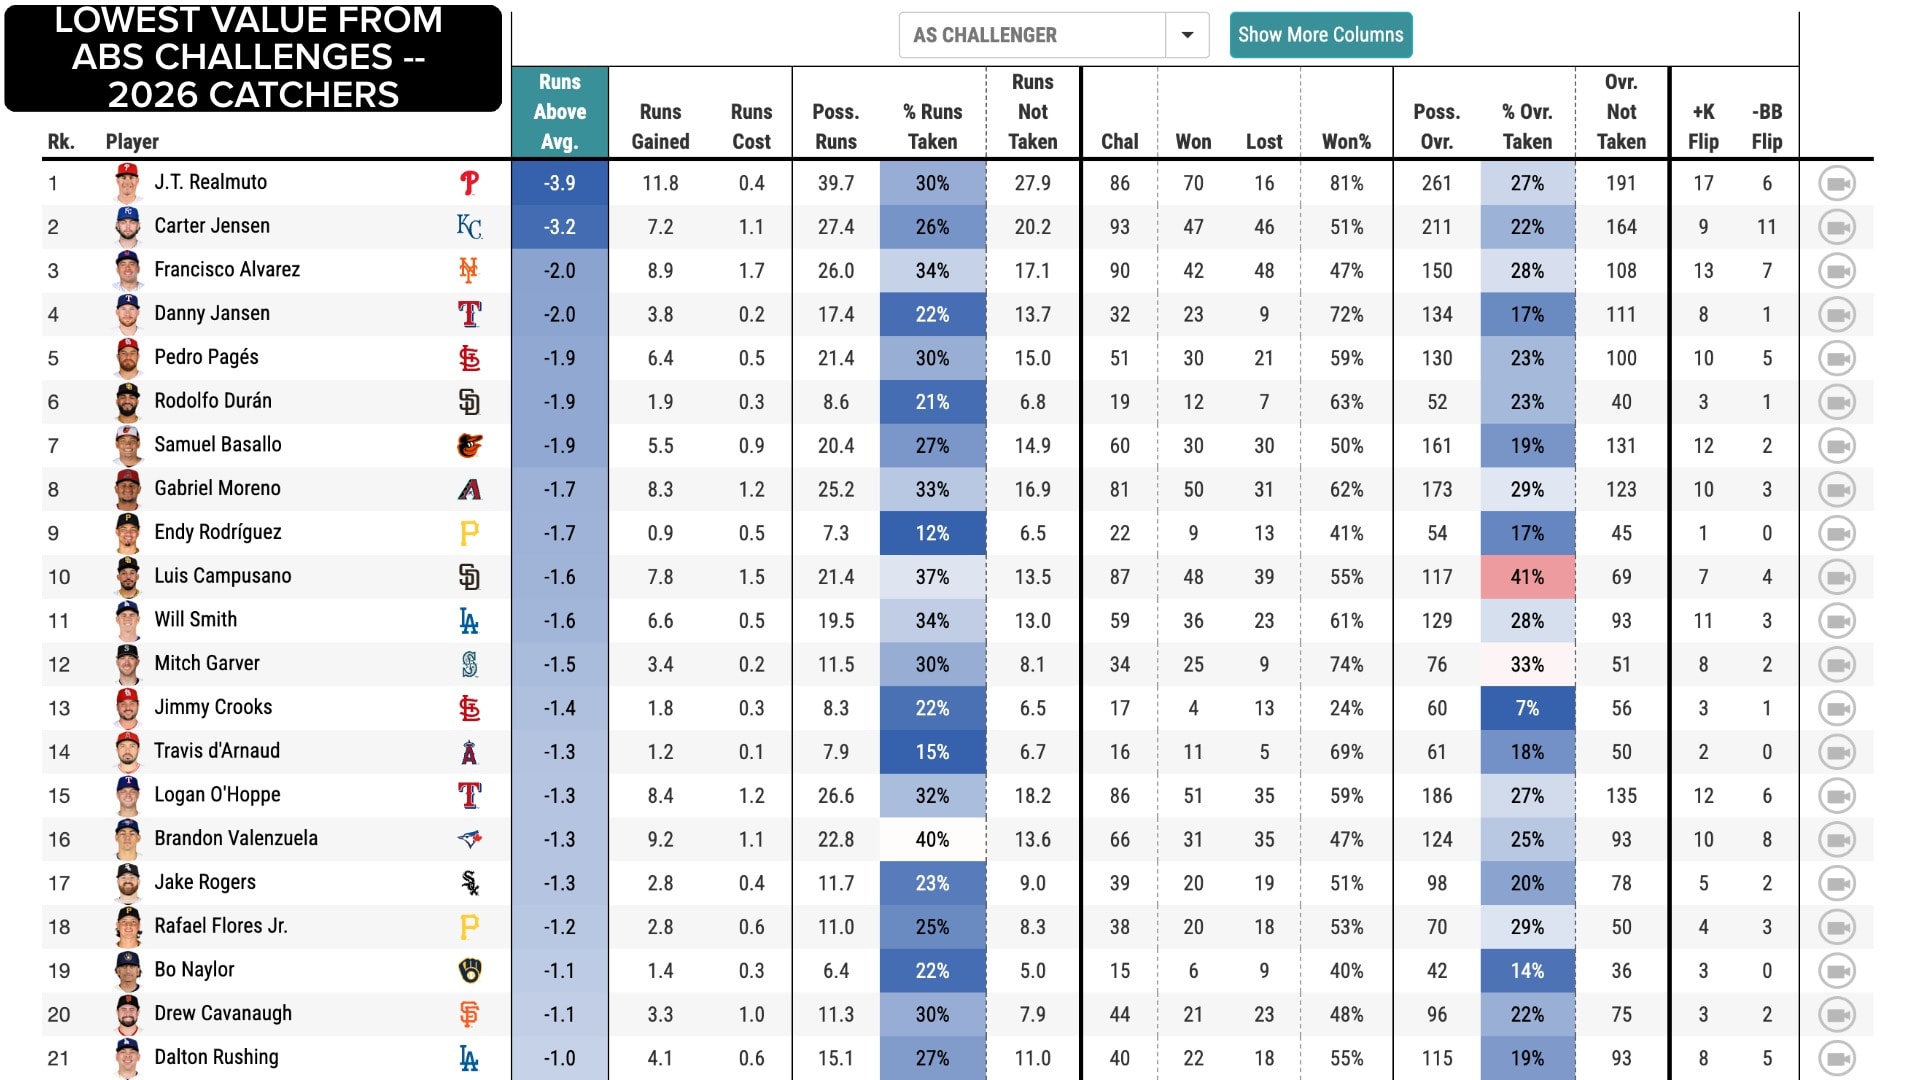
On the other hand, as a catcher, J.T. Realmuto won 81% of his challenges, but he only challenged 27% of the calls he could have overturned. Because he was so passive, his value as a challenger was the lowest of any catcher despite his high winning percentage.
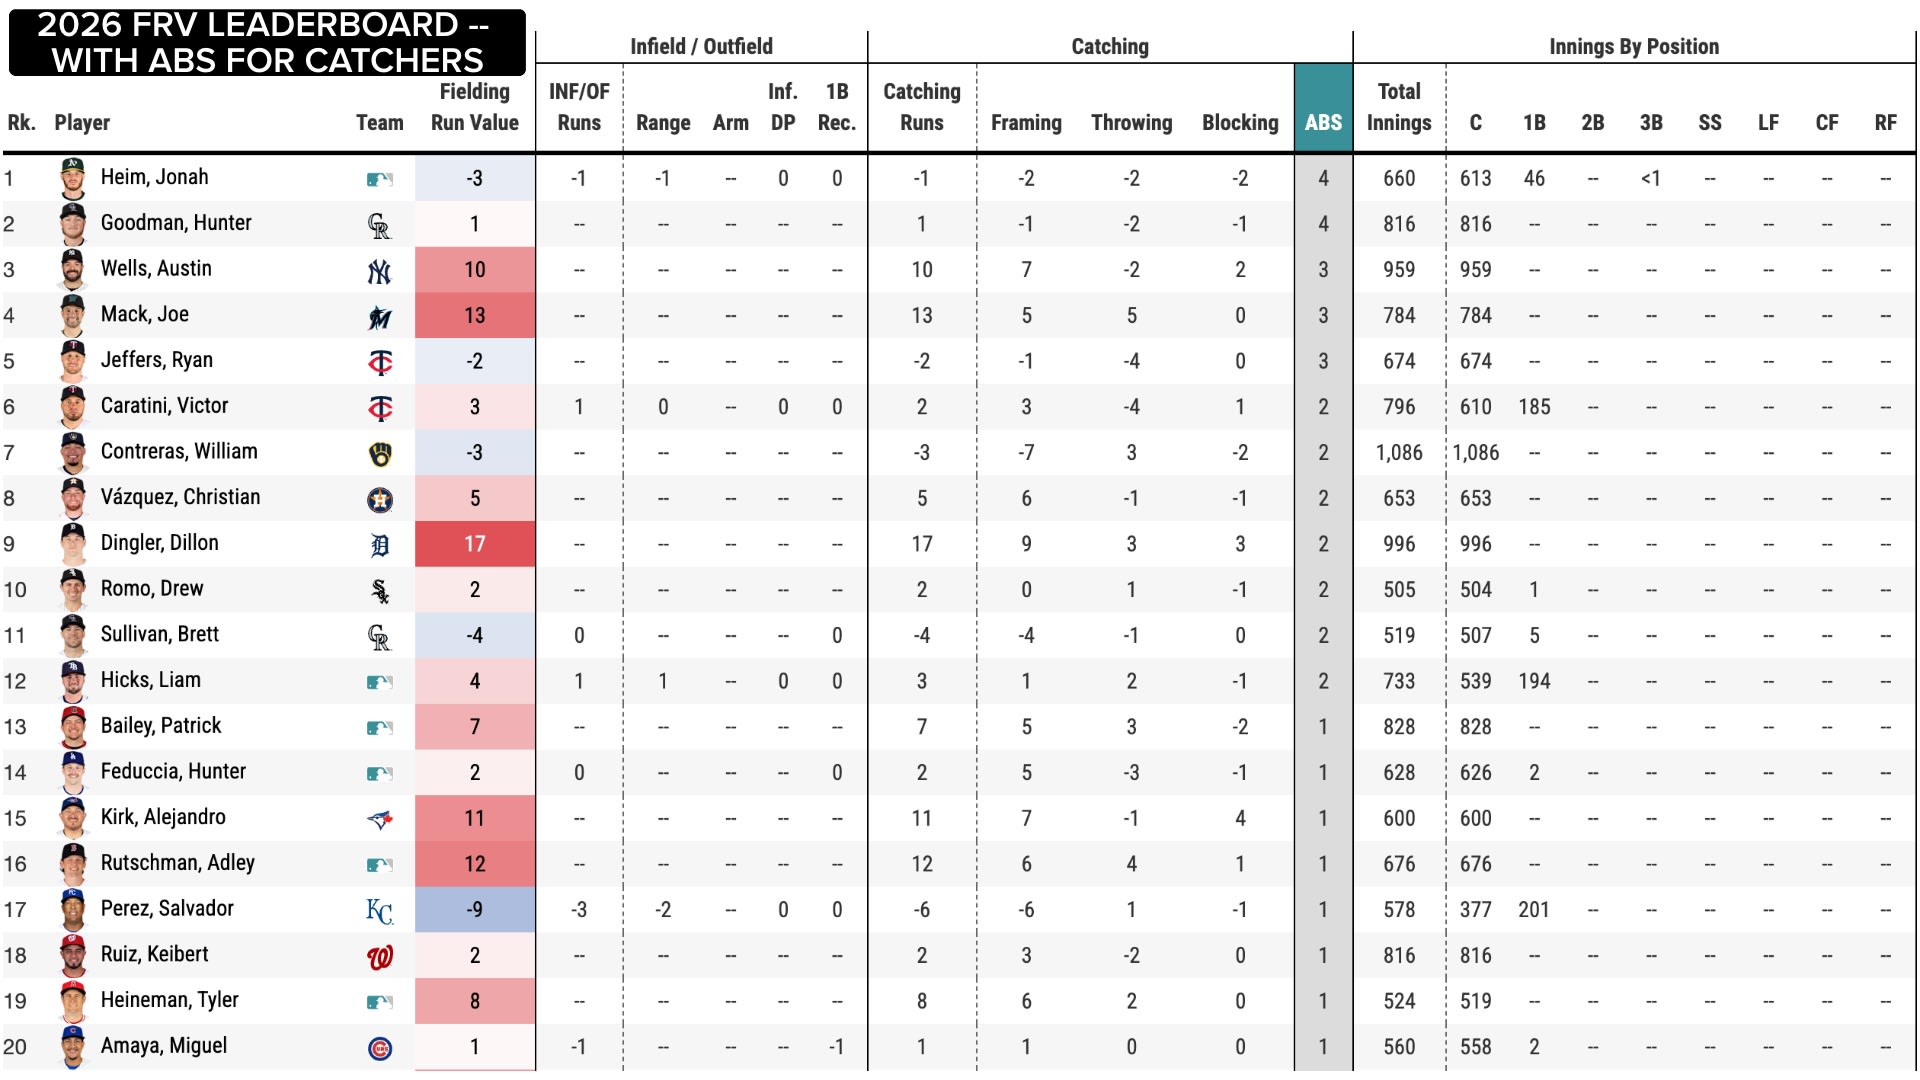
2: In addition, the value created by catchers from their ABS challenges is now incorporated into the Fielding Run Value leaderboard.
The First Base Receiving and Scoops Leaderboard adds an important layer to Statcast's defensive metrics.
Receiving Outs Above Average is now available for all MLB first basemen from 2021-present. The leaderboard also tracks a first baseman's total outs made under six different categories of throw: On Target, High, Low, Wide, Scoops and Bounces.
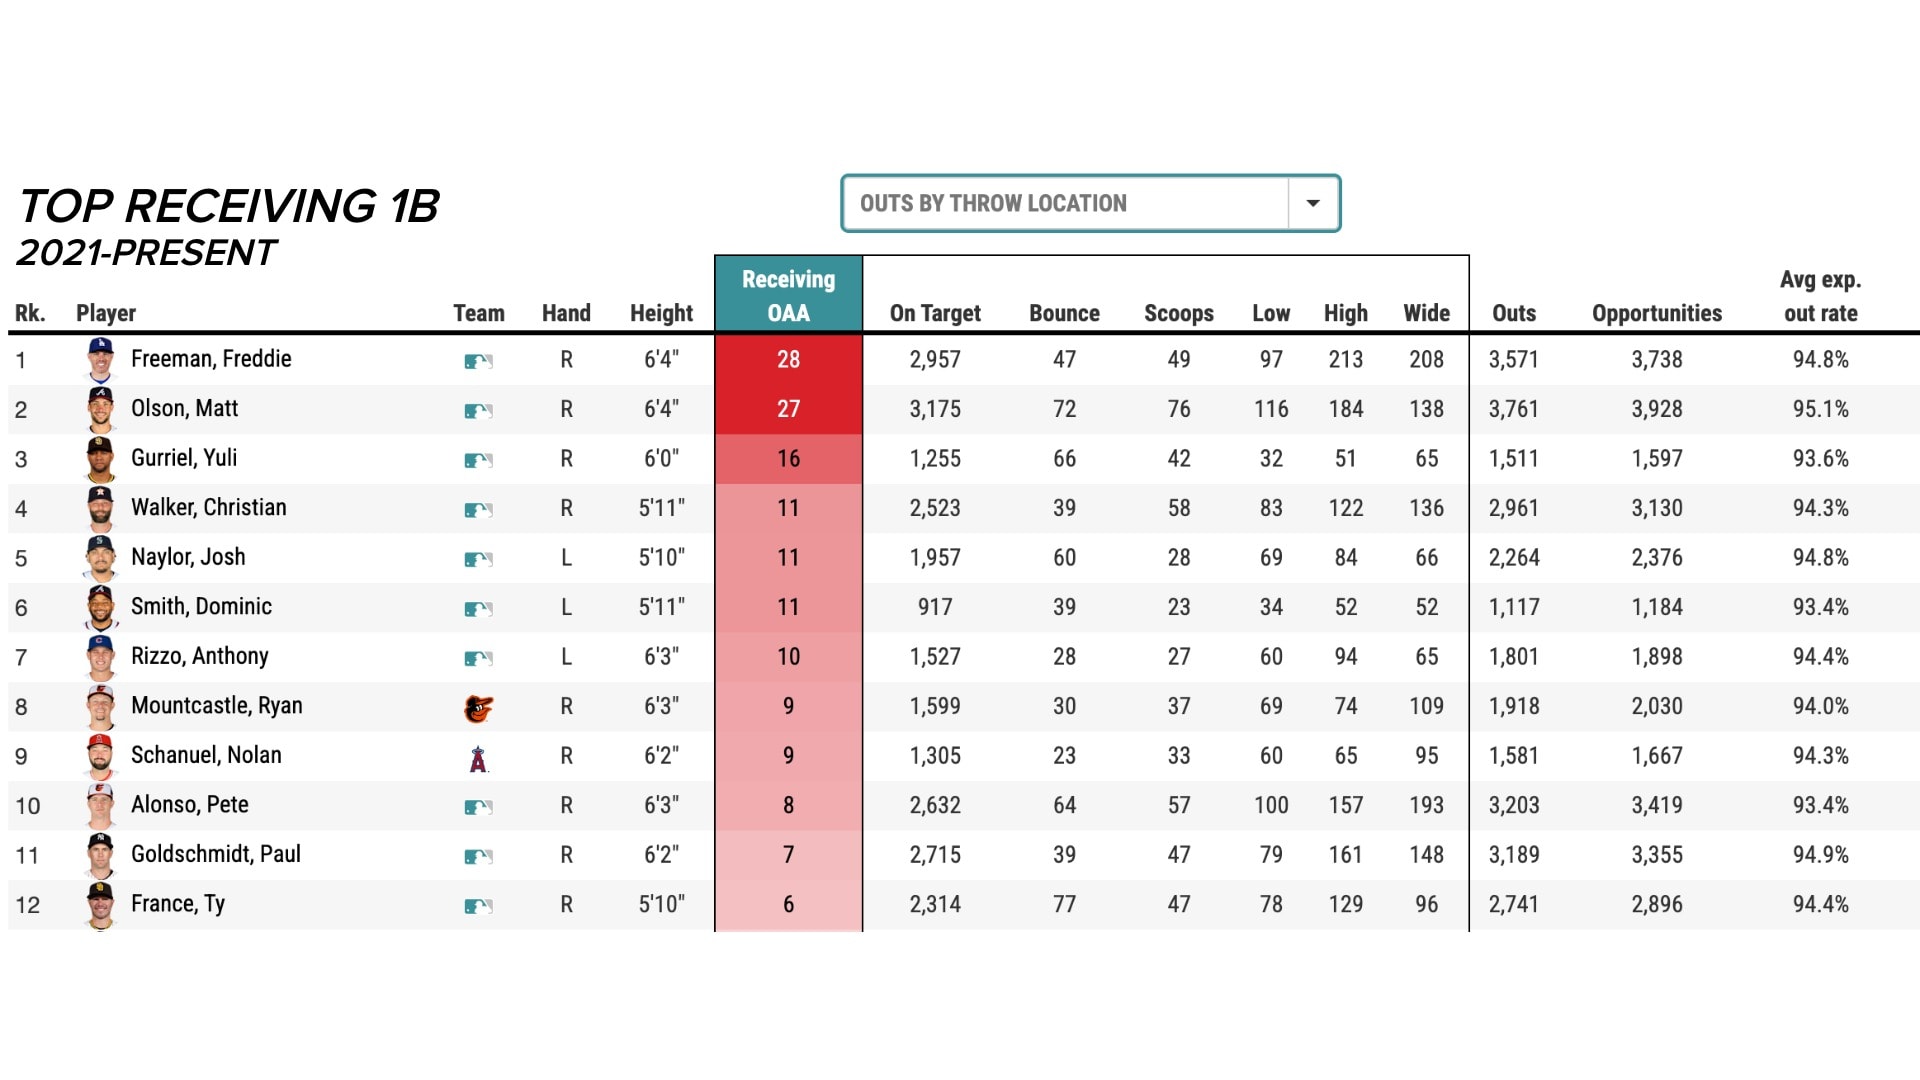
A first baseman's receiving OAA is based on his ability to successfully convert throws from his infielders into outs, considering the difficulty of those opportunities.
The First Base Receiving leaderboard also includes a visual for every first baseman, showing all of his receiving opportunities on a 3D field. Hovering over an individual play shows the trajectory of the throw, as well as the position of the first baseman and runner when he is catching the ball.
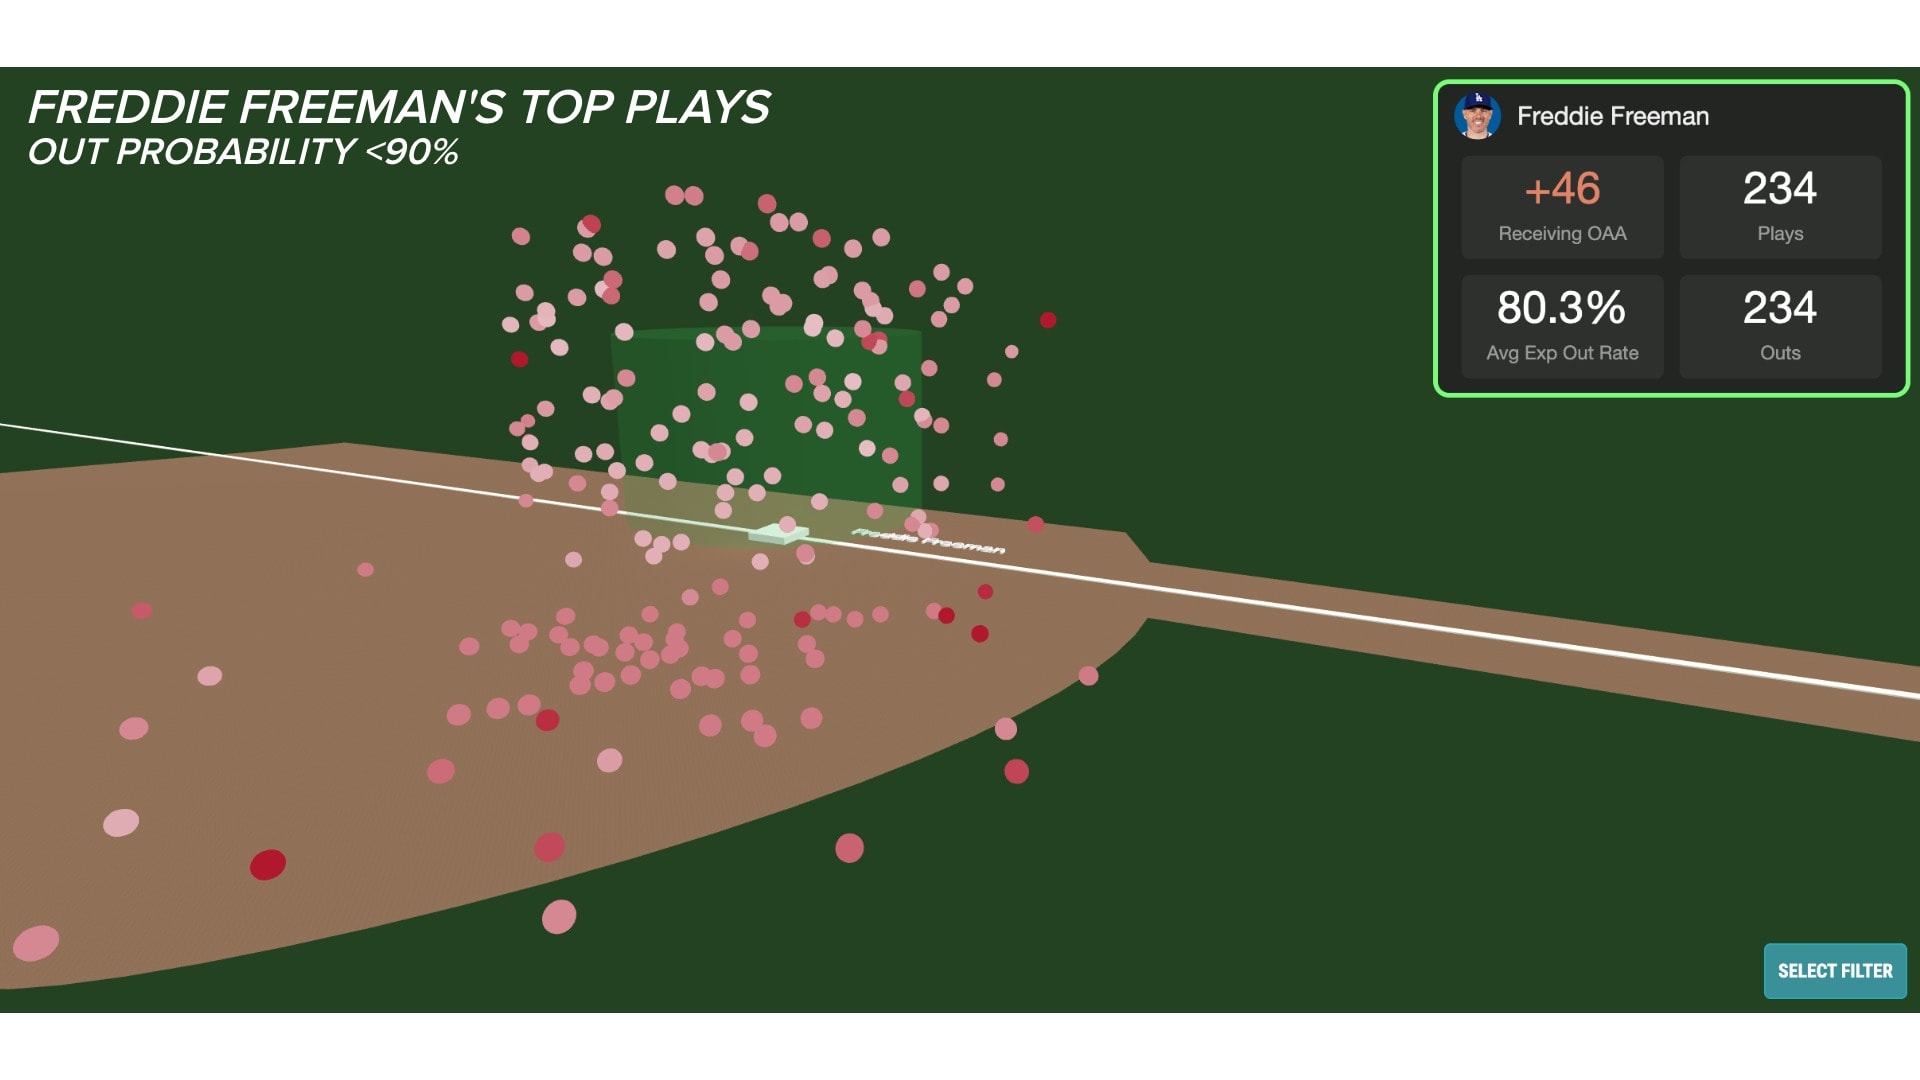
First Base Receiving OAA is now factored into Fielding Run Value.
Baseball Savant's new Player Comparison Tool allows you to compare multiple batters or pitchers' MLB percentile rankings in various Statcast metrics, in the style of the visuals at the top of Baseball Savant player pages.
The Player Comparison Tool is fully customizable. Select up to nine batters or pitchers for comparison, and select any combination of the available stats across various categories (player value, batting, pitching, fielding, catching, running). Use default stat groupings for batters, pitchers or catchers, or pick and choose whichever percentiles you want to compare.
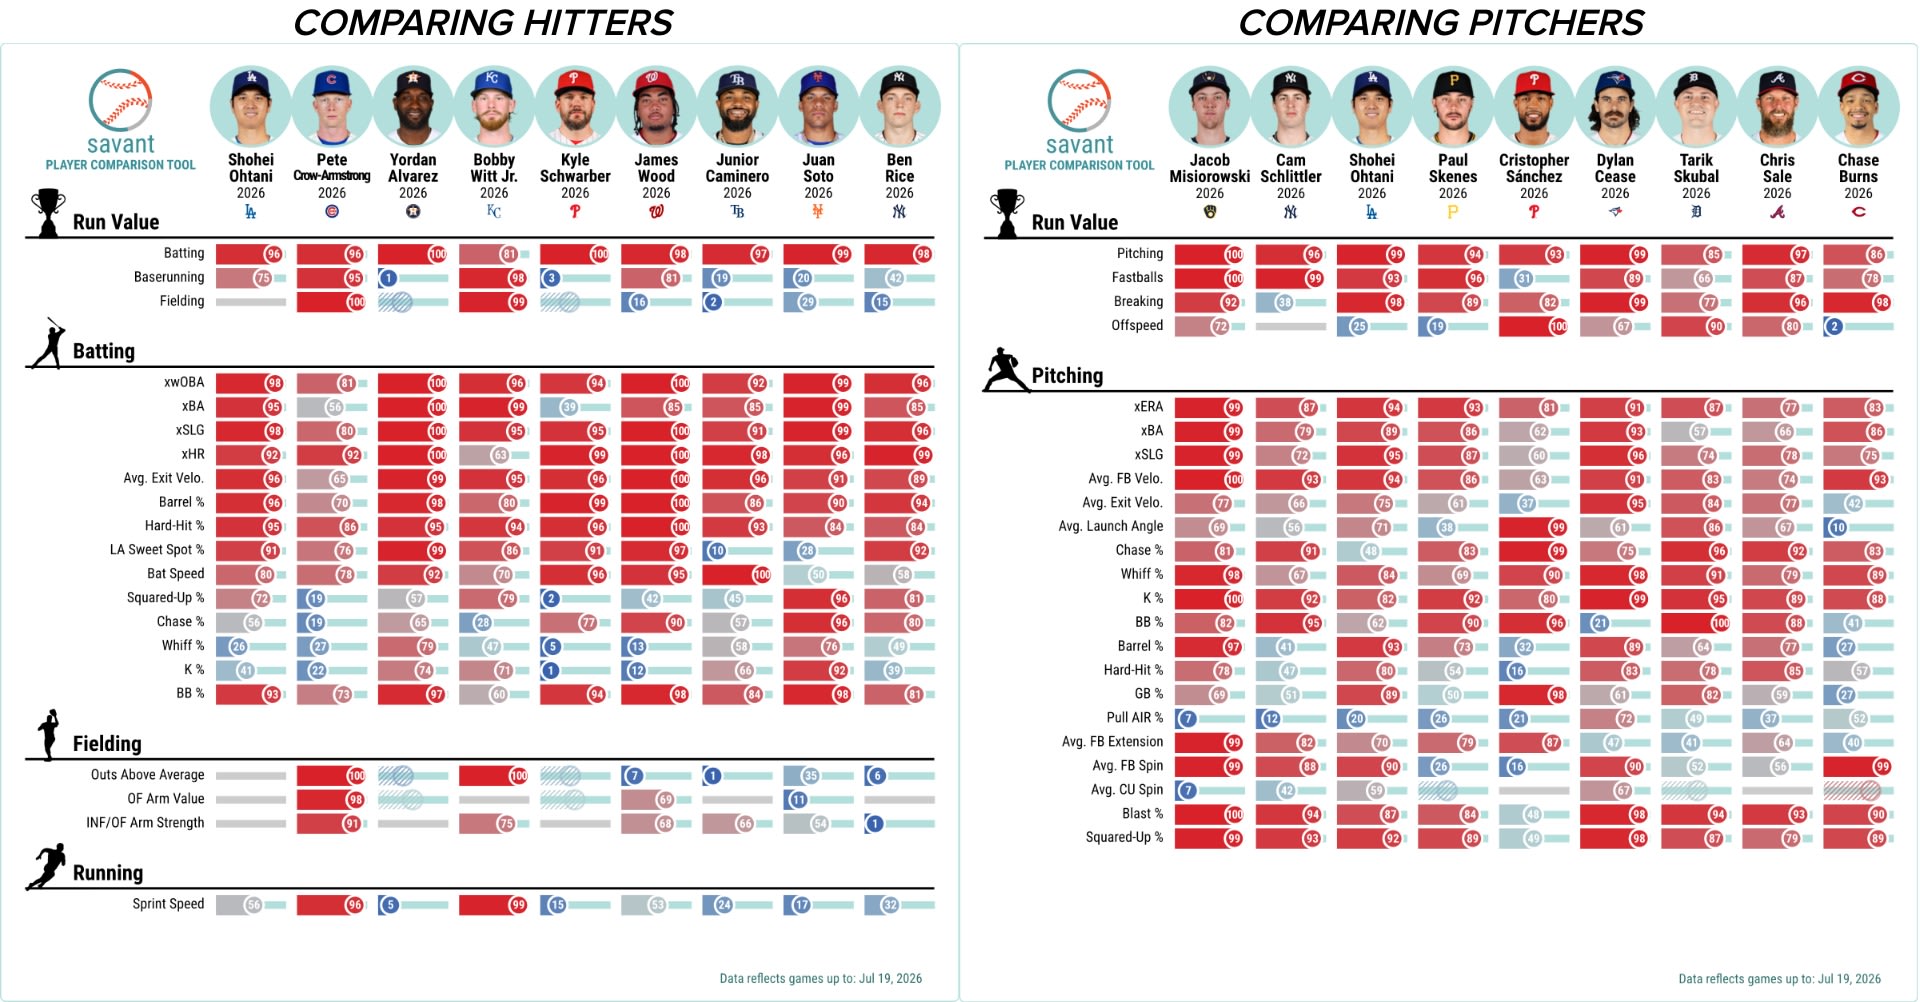
Select players by searching for any player name -- you can also filter by season, player type, team and position -- or choose from Trending Players or Suggested Players (based on your players currently selected).
Player seasons can be selected for the full Statcast era (2015-present), but some stats may not be available for all seasons (for example, bat speed is available for 2023-present).
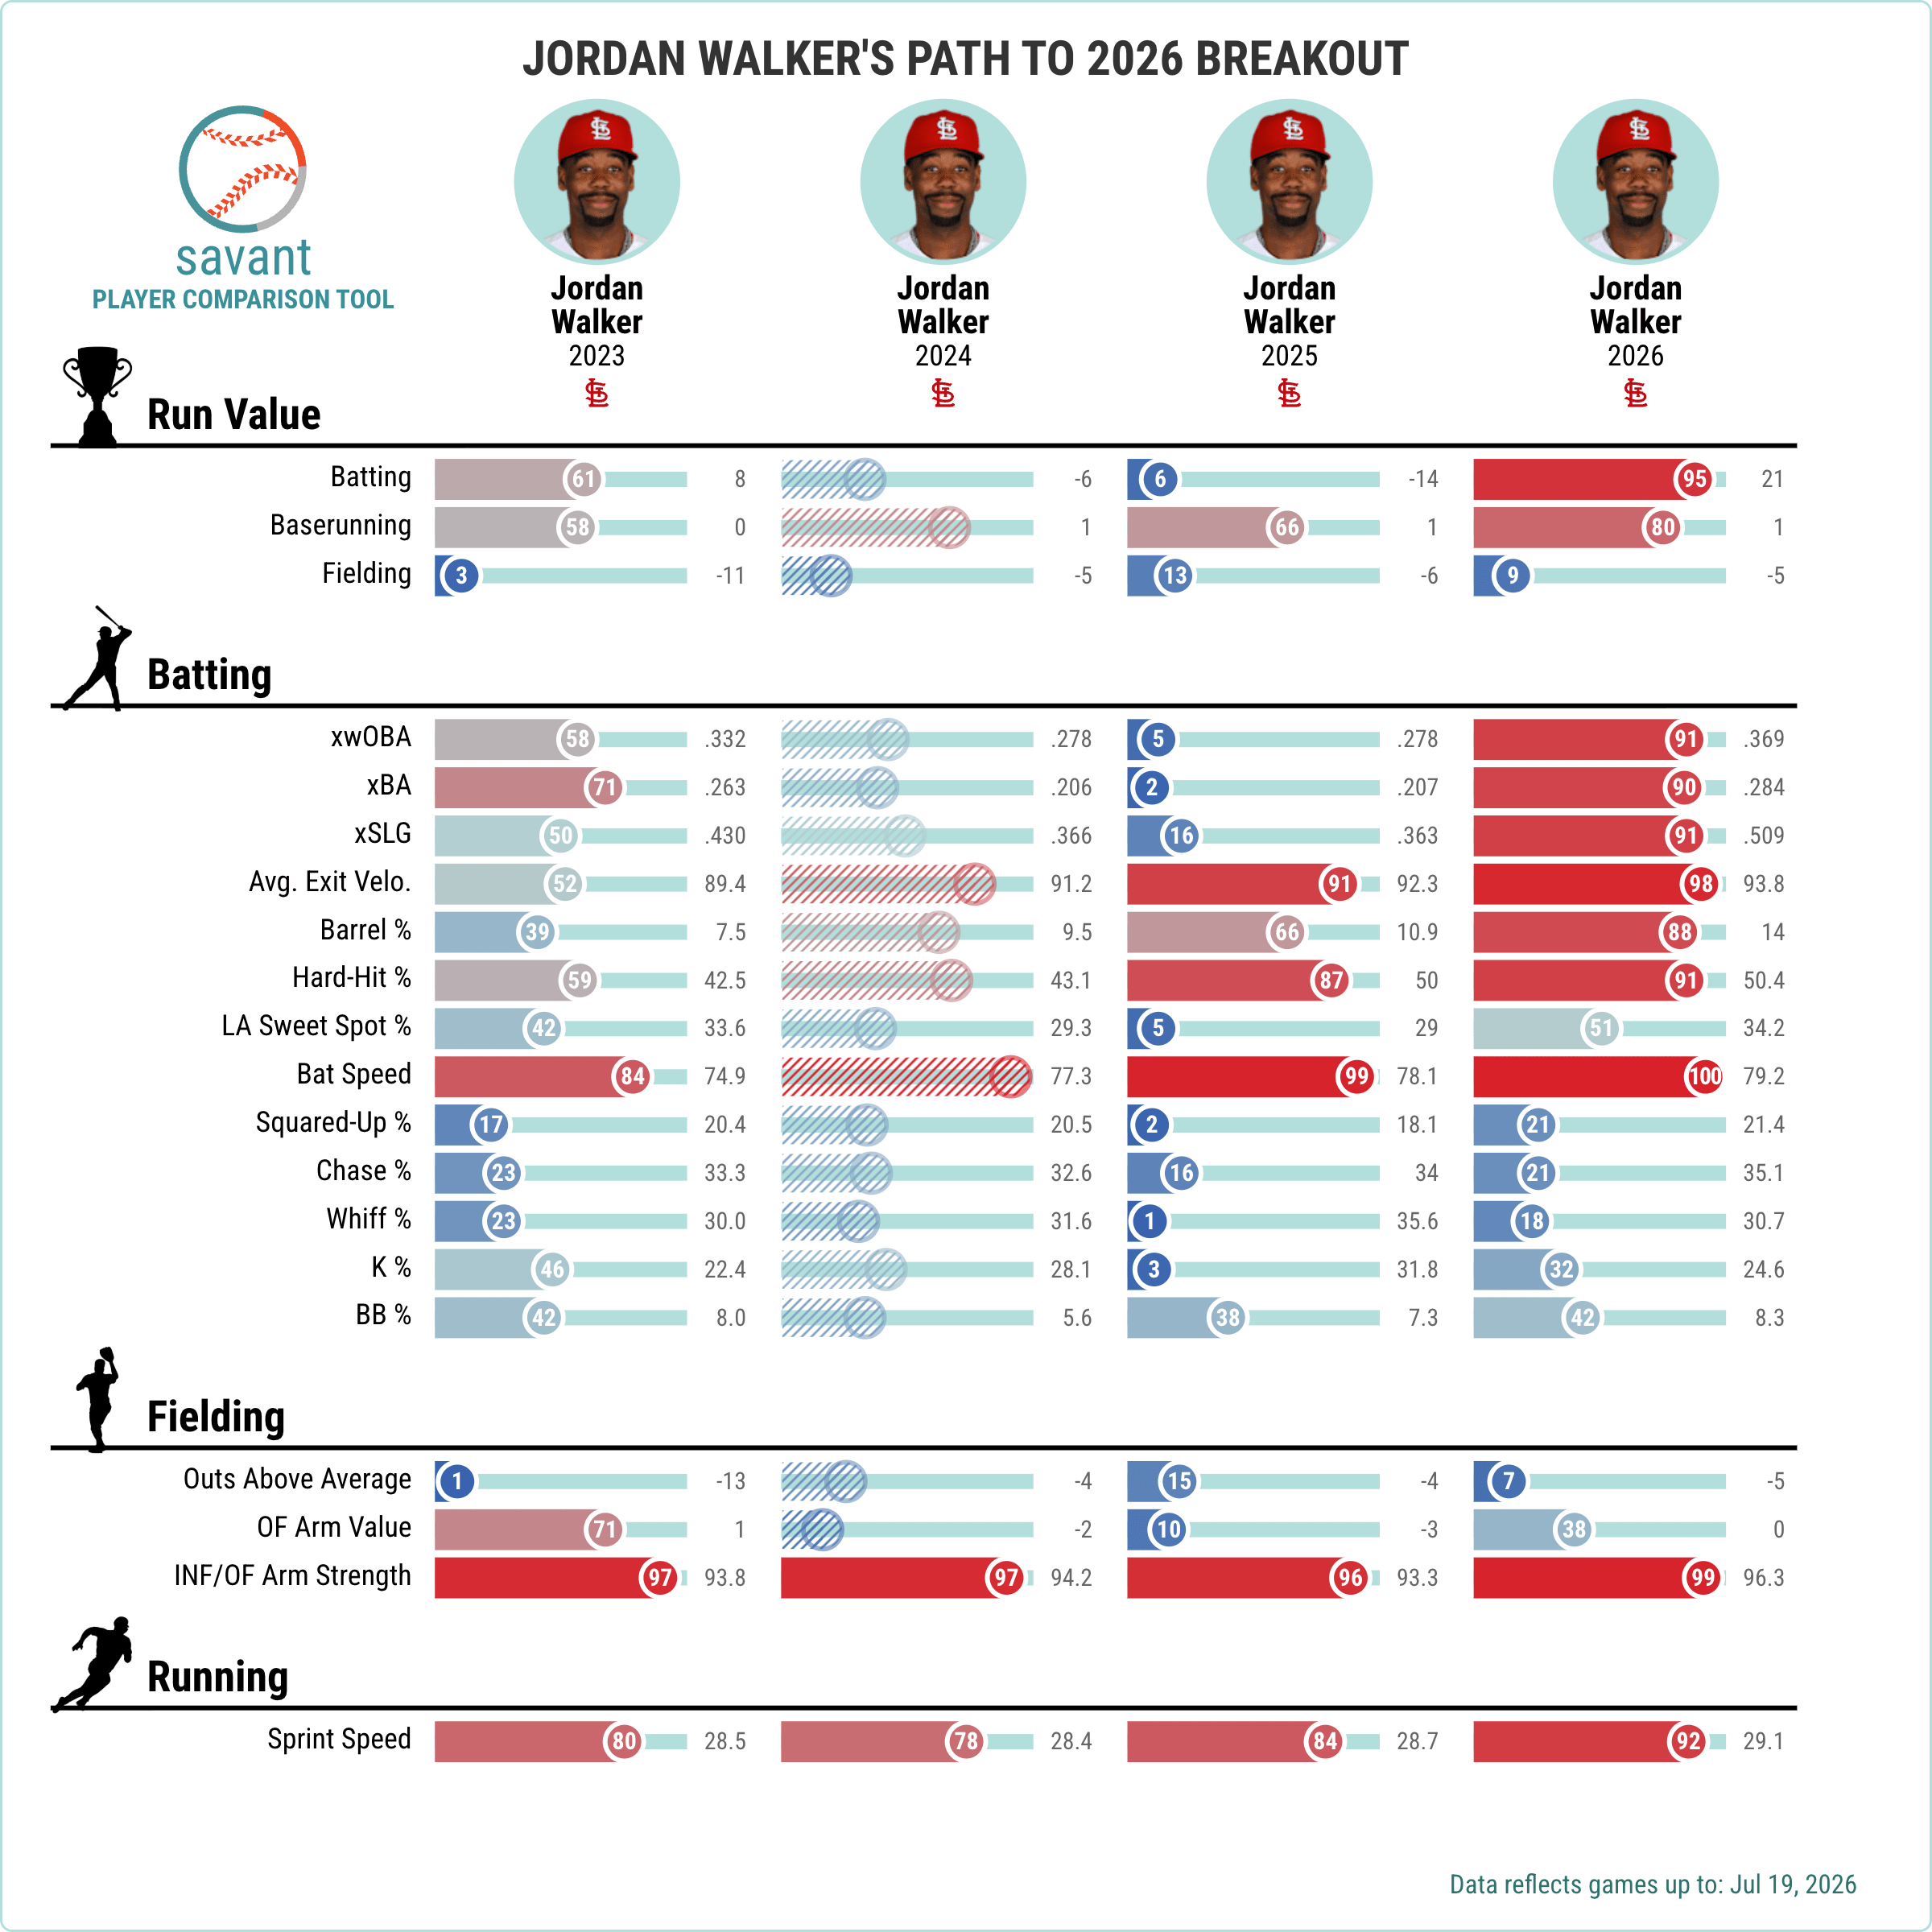
Under Settings, you can choose to highlight the "winner" of any percentile comparison, as well as show the actual stat value for a player as opposed to simply his MLB percentile for that stat.
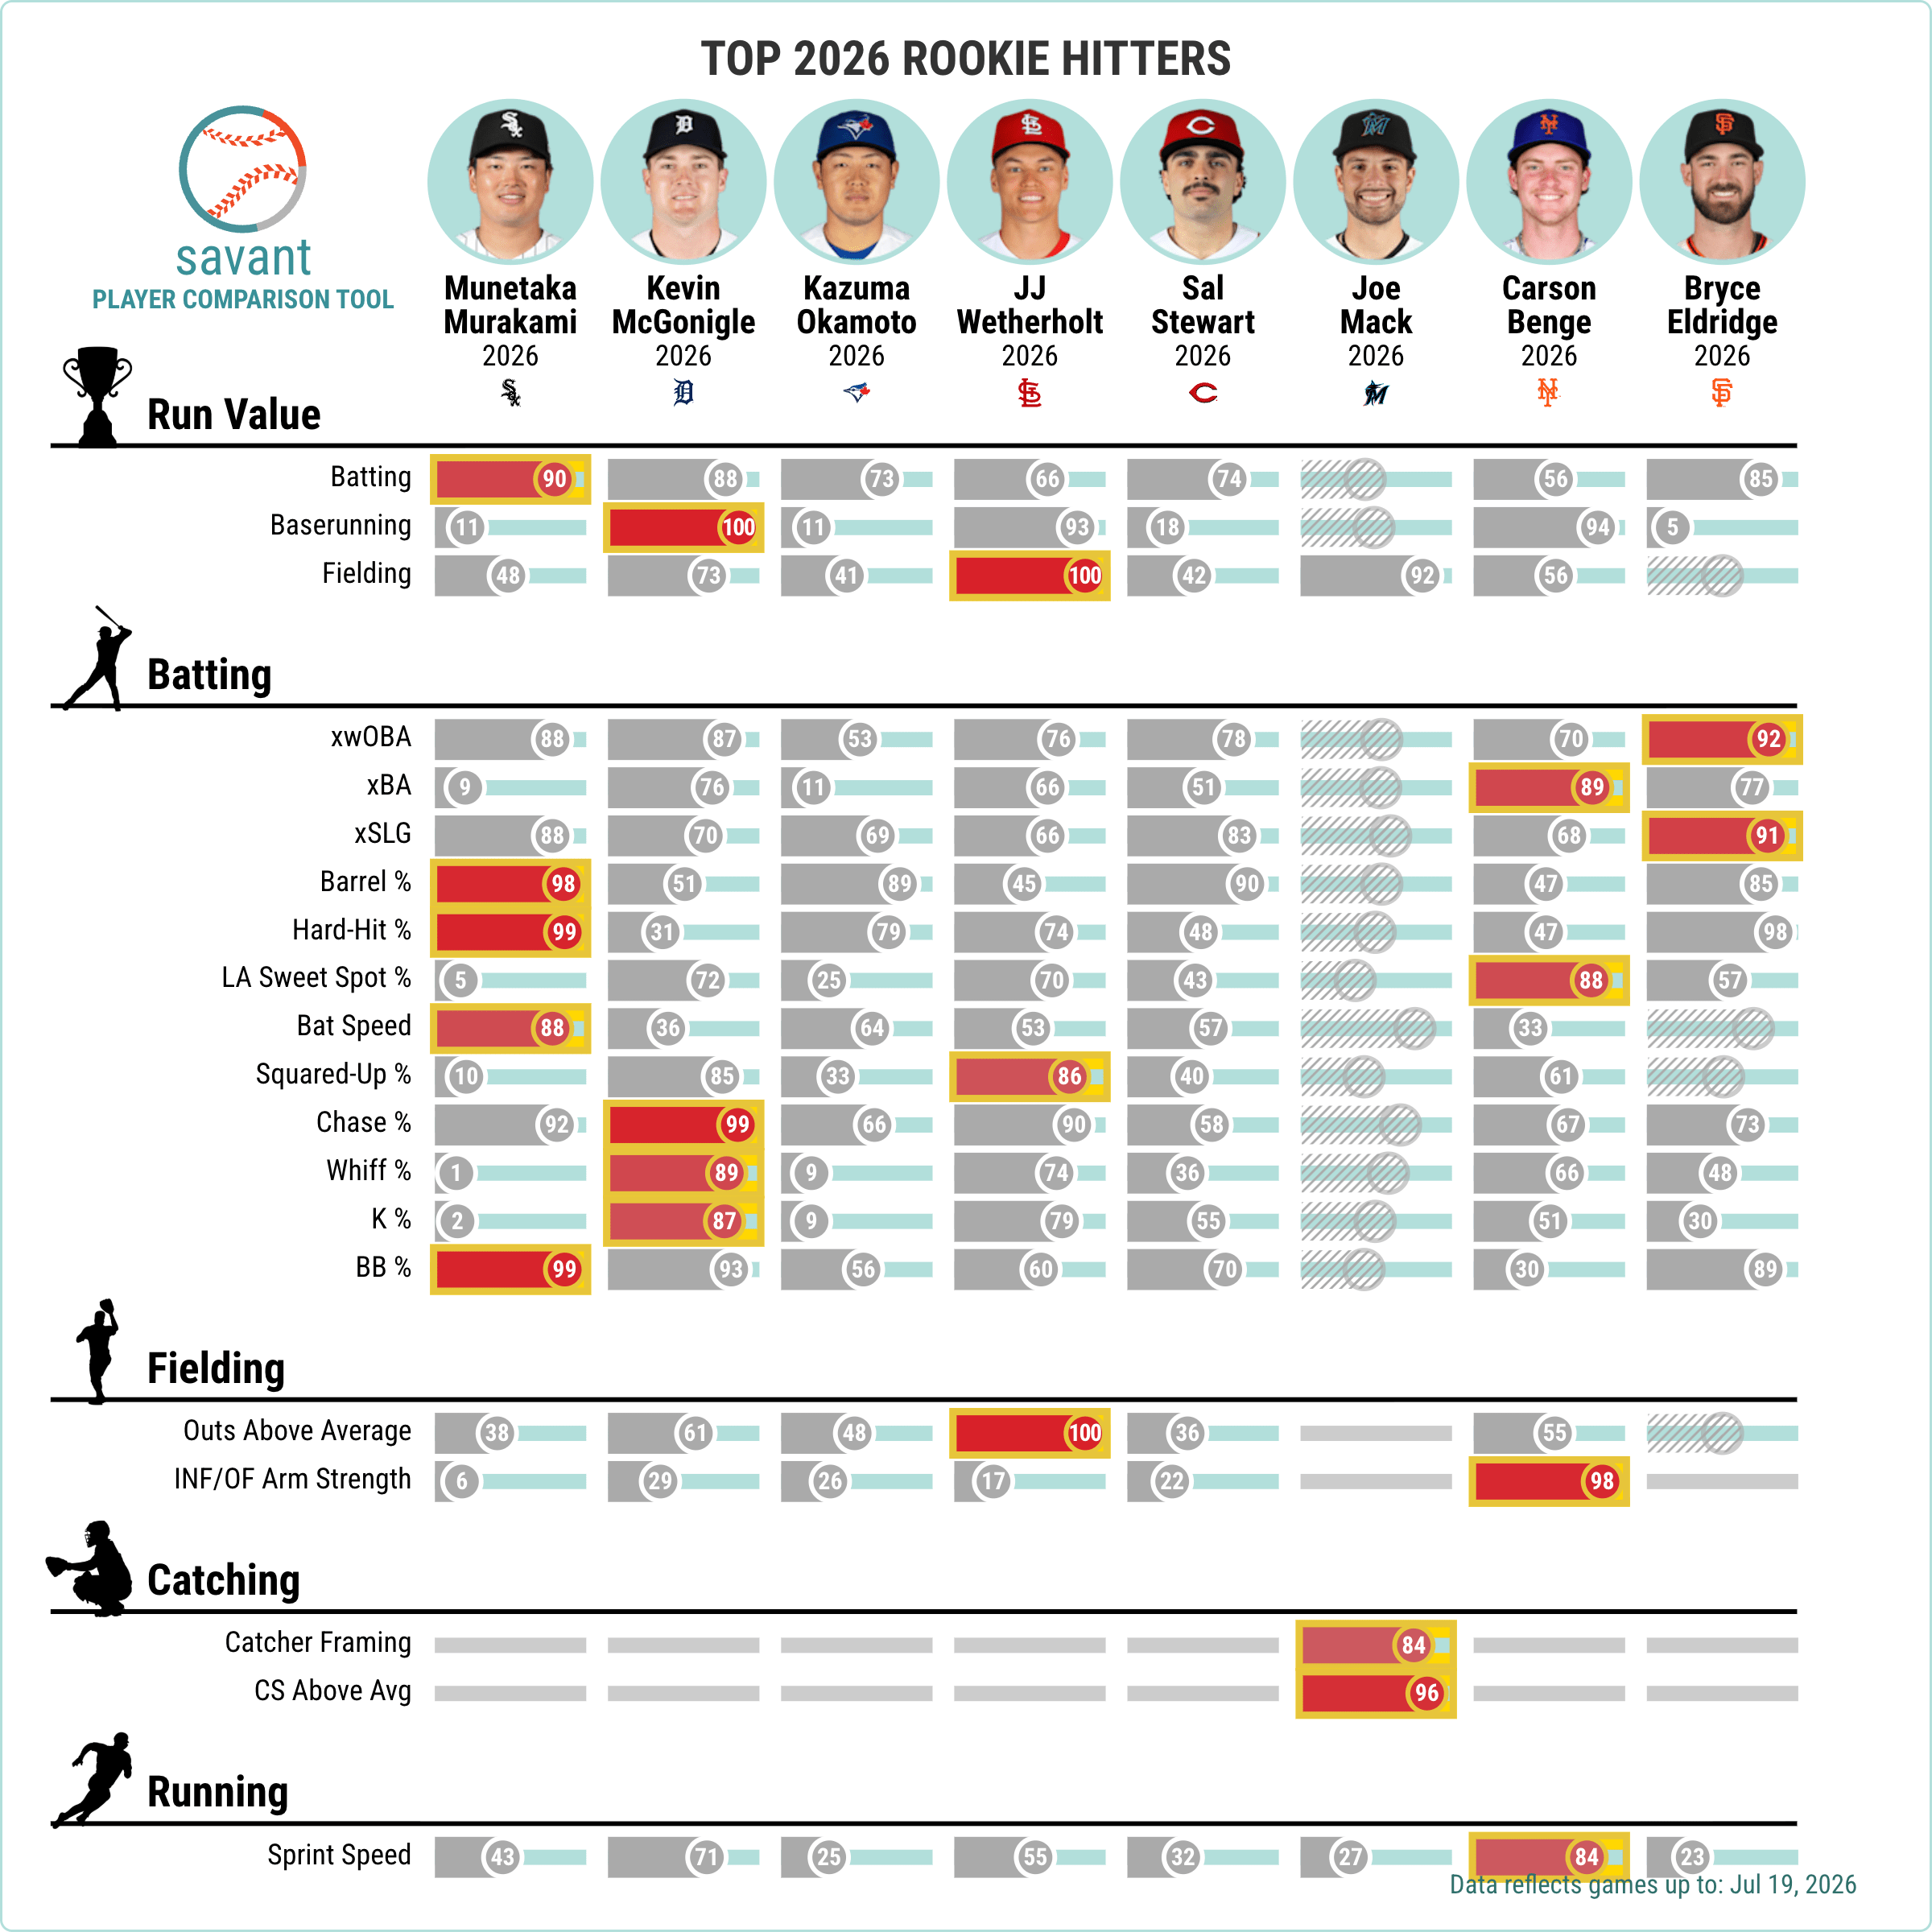
You can also add a title to any player comparison and download the image to share.
The Player Comparison Tool is accessible from the "Compare Players" button on the toolbar at the top of the Baseball Savant site. Additionally, anywhere on Baseball Savant you see a blue-and-red "VS" icon with two small percentile sliders is a link to the Player Comparison Tool.
For some examples of how to use the Player Comparison Tool, see here >>
Along with the new Player Comparison Tool, Baseball Savant's Percentile Rankings Leaderboards are now updated with a Filter option for both Batters and Pitchers.
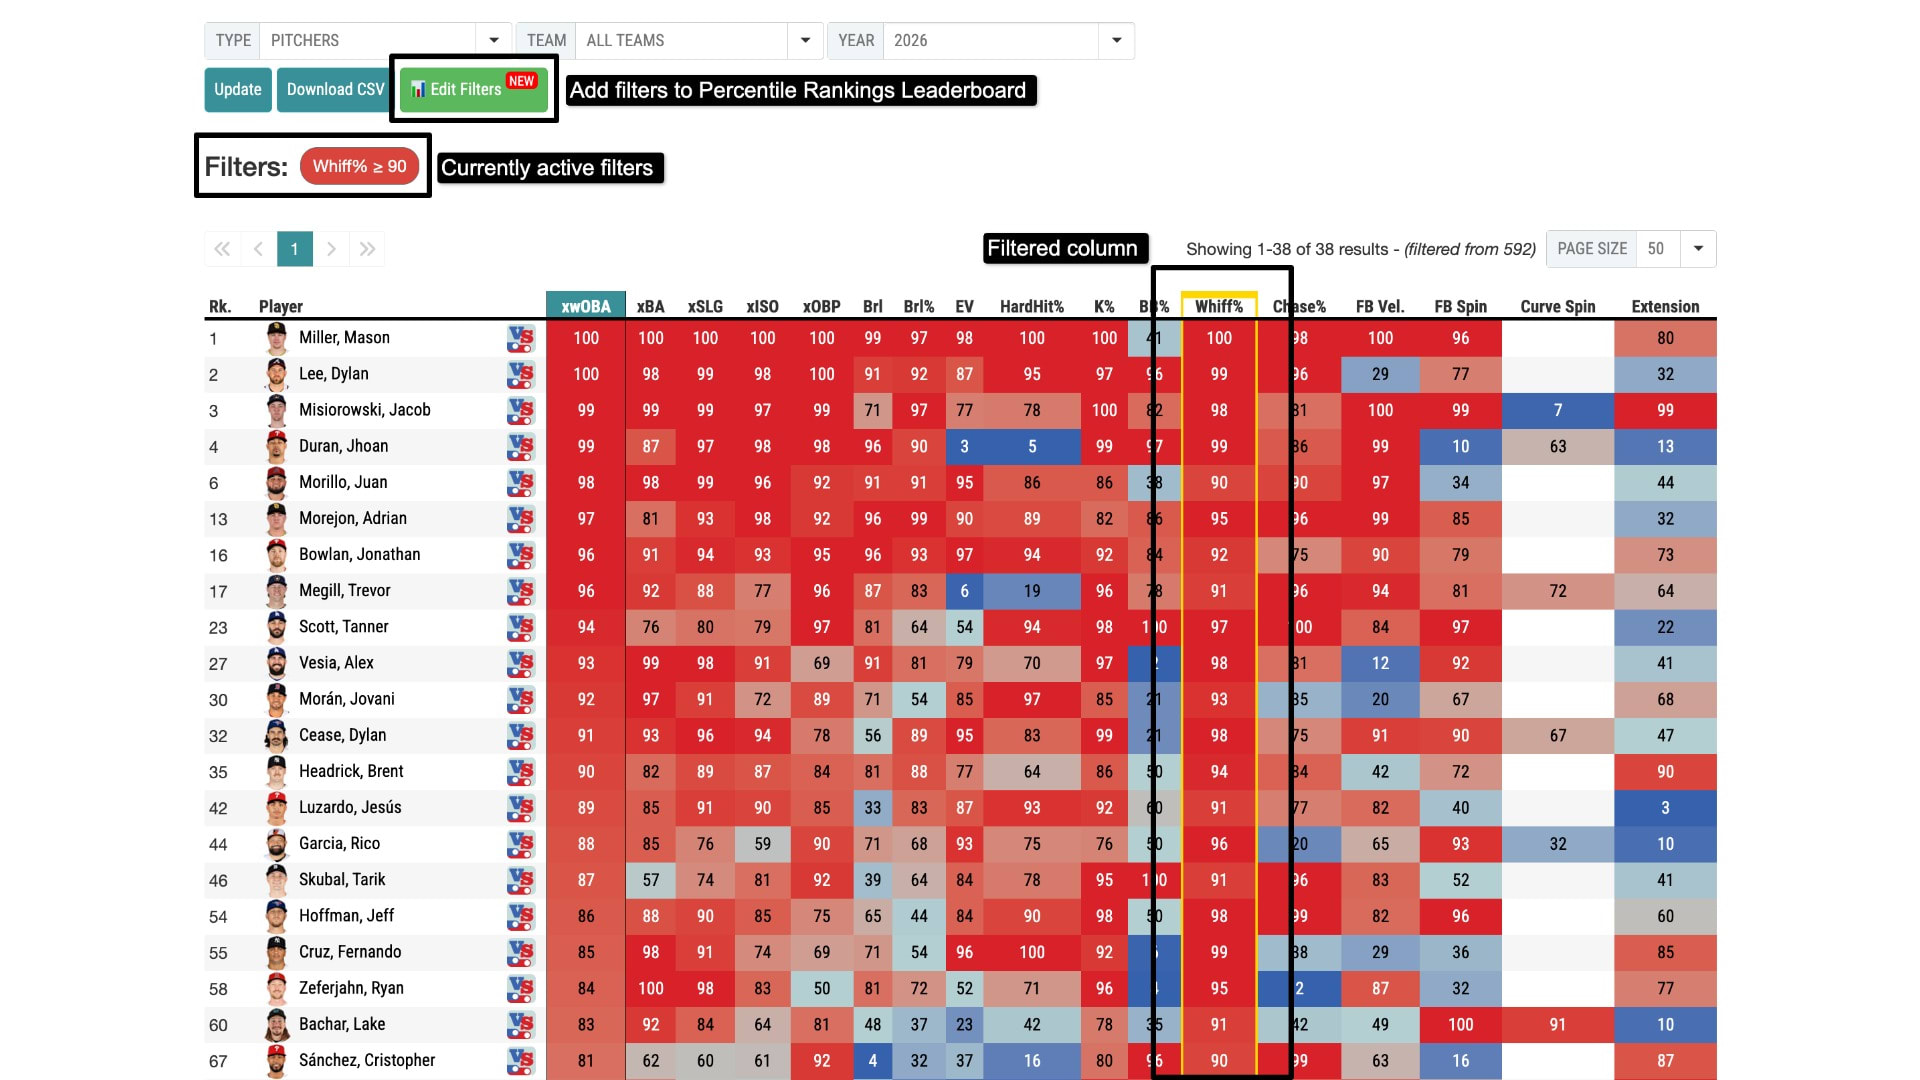
Filters are available to set baselines for any percentile category. For example, you can filter the leaderboard to pitchers with a whiff rate in the 90th percentile of MLB or higher.
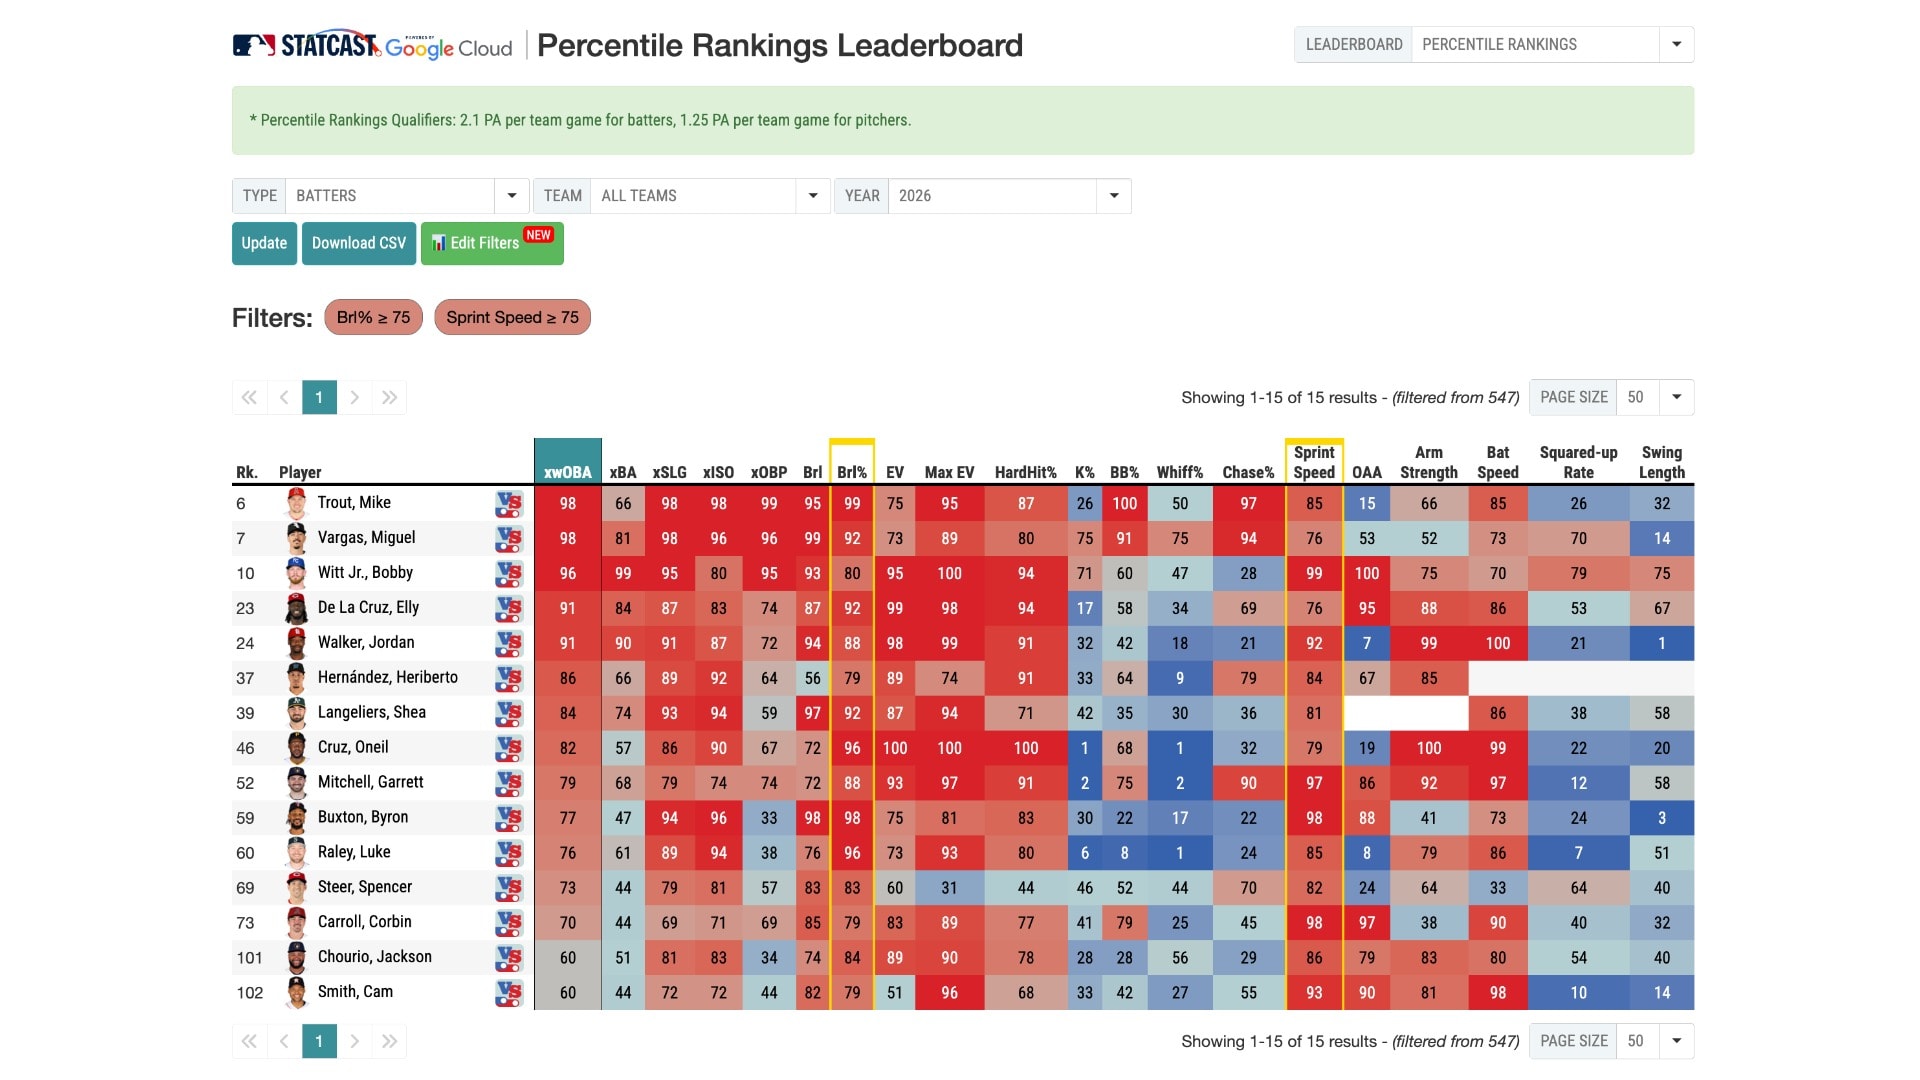
You can select multiple percentiles to filter. For example, you can filter the leaderboard to batters in the 75th percentile of MLB or better in both barrel rate and sprint speed.
To pick percentiles to filter, use the "Edit Filters" button at the top of the Percentile Rankings Leaderboard page. Click "Add Filter" to choose any stat on the leaderboard, and click "Finish Editing" to save your changes.
From the Percentile Rankings Leaderboard, clicking on the "VS" icon next to any batter or pitcher will take you to the Player Comparison Tool with that player selected for the relevant season.
New bat tracking leaderboards are now available for Swing Timing and Miss Distance.
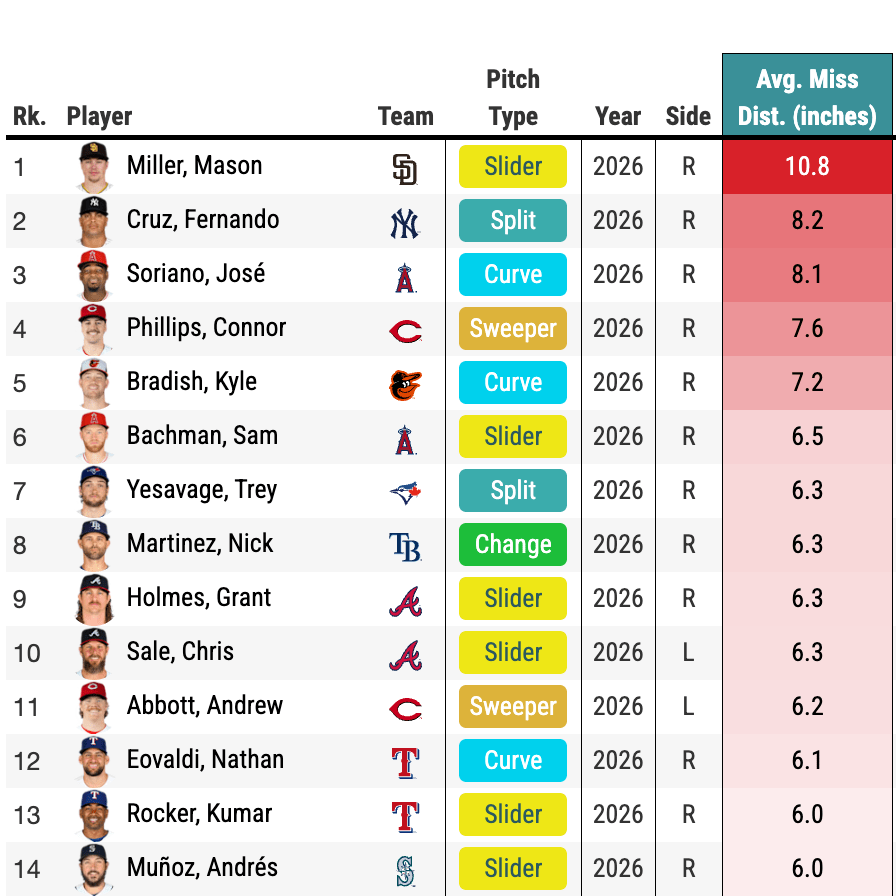
Miss Distance measures the distance between the ball and the barrel of the bat on a swing-and-miss. This stat measures: Which pitchers miss bats by the most? and When a hitter whiffs, how much does he whiff by?
You can use the miss distance leaderboard to see, for example, which pitch types generate the biggest miss distance (Mason Miller's slider misses bats by over 10 inches on average), or see the biggest individual whiffs (Clayton Kershaw once got Ronny Mauricio to swing and miss at a curveball by 58 inches).
Swing Timing measures where the bat is compared to the ball on a swing, in every dimension. There are three categories of swing timing:
On the swing timing leaderboard, you can see the percentage of swings a pitchers induces in each timing category (Jacob Misiorowski's fastball gets hitters to swing over 60% of the time), or the percentage of a hitter's swings that fall into each timing category (over 70% of Luis Arraez's swings are on time). You can also see how early/late swings are, how far over/under and how far tied up/flailing.
Visuals are also available showing how a hitter's swings, or a pitcher's swings induced, are distributed across the different swing timing categories.
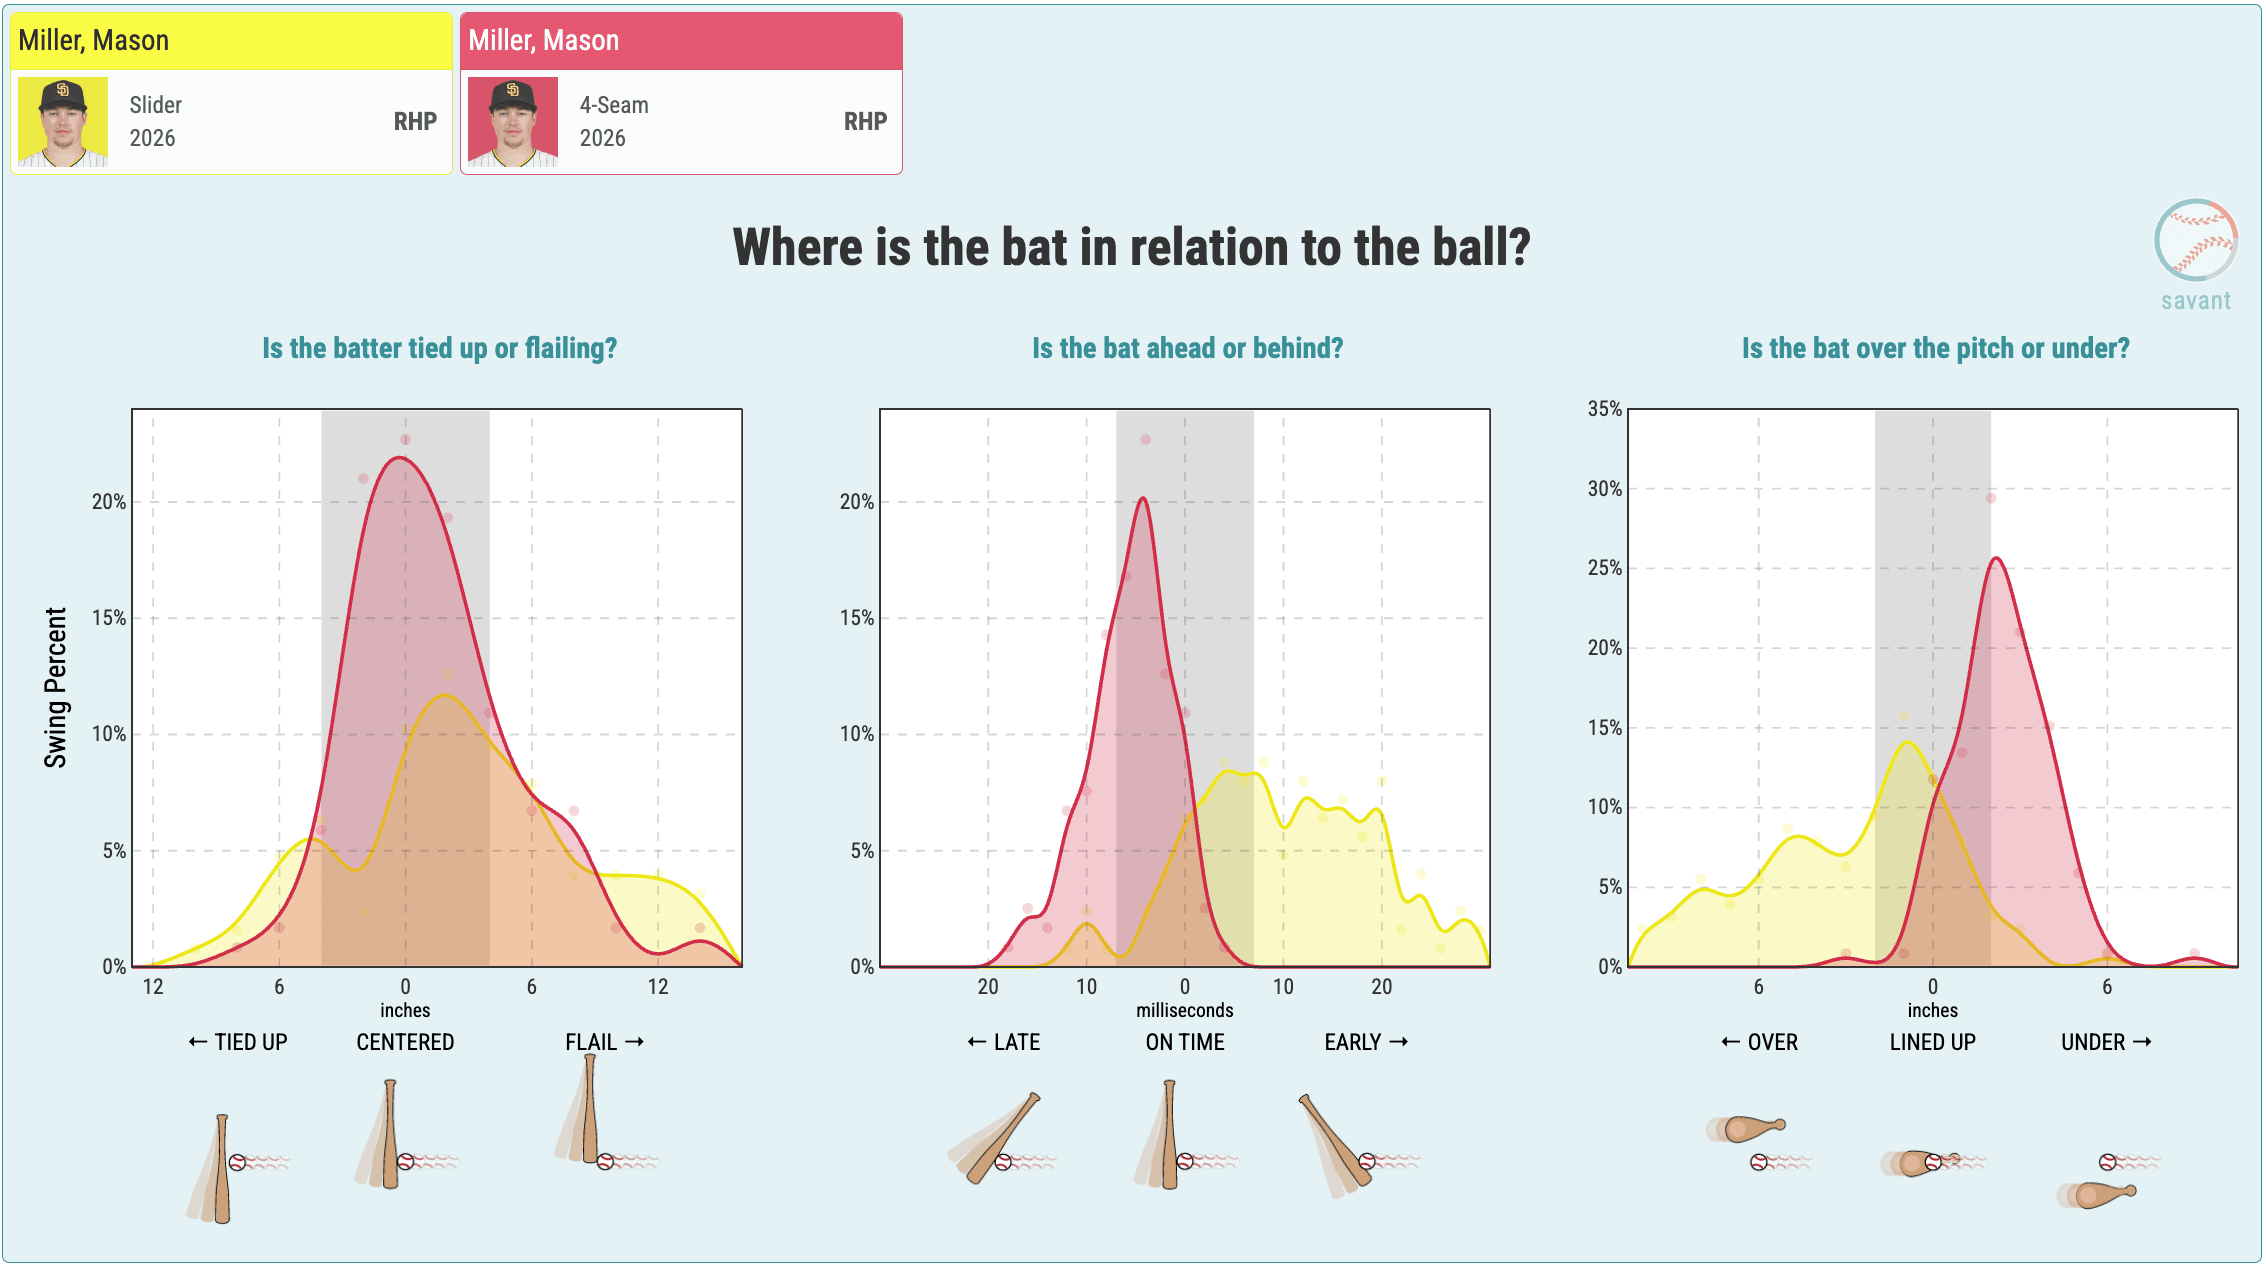
Combining the swing timing categories also give us two other new stats:
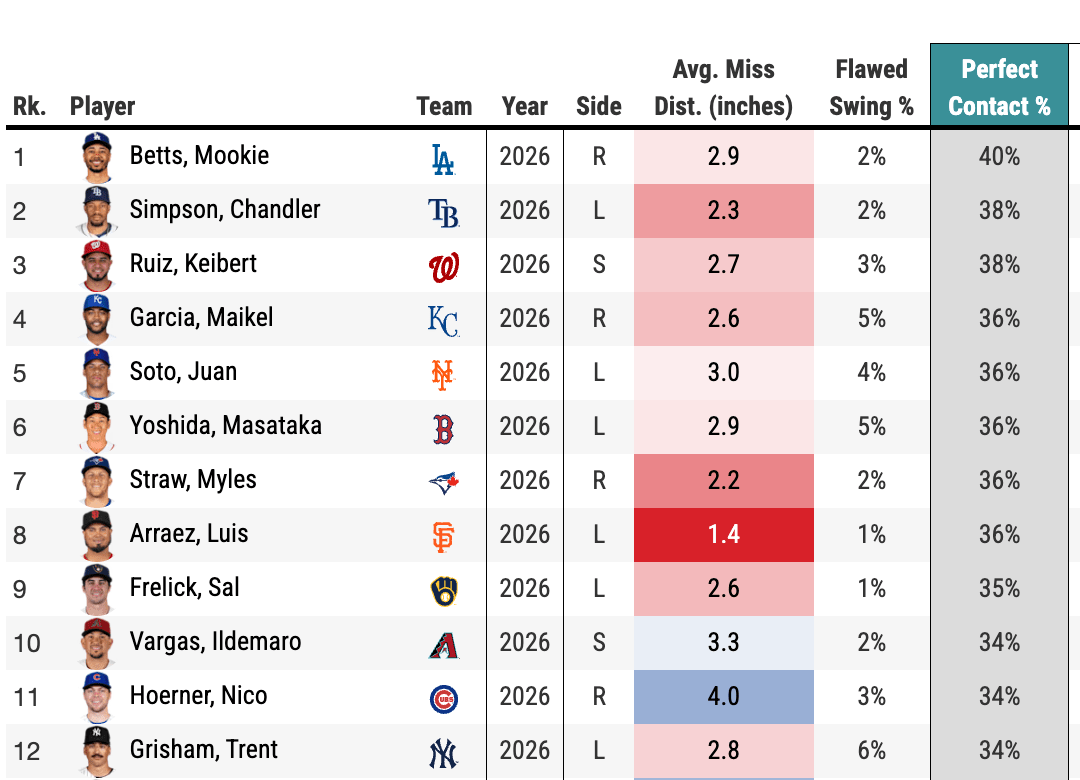
Swing timing data is also viewable on Baseball Savant player pages under the Bat Tracking tab, and miss distance is searchable in the Statcast Search.
Swing timing and miss distance data is available starting with the second half of the 2023 season. It is available for all MLB hitters and pitchers, and filterable by a variety of criteria.
