- ABS challenge stats are now live on Baseball Savant, on two new pages:
1) A high-level, season-at-a-glance ABS dashboard here: https://baseballsavant.mlb.com/abs
2) A detailed ABS leaderboard with Statcast challenge metrics here: https://baseballsavant.mlb.com/leaderboard/abs-challenges
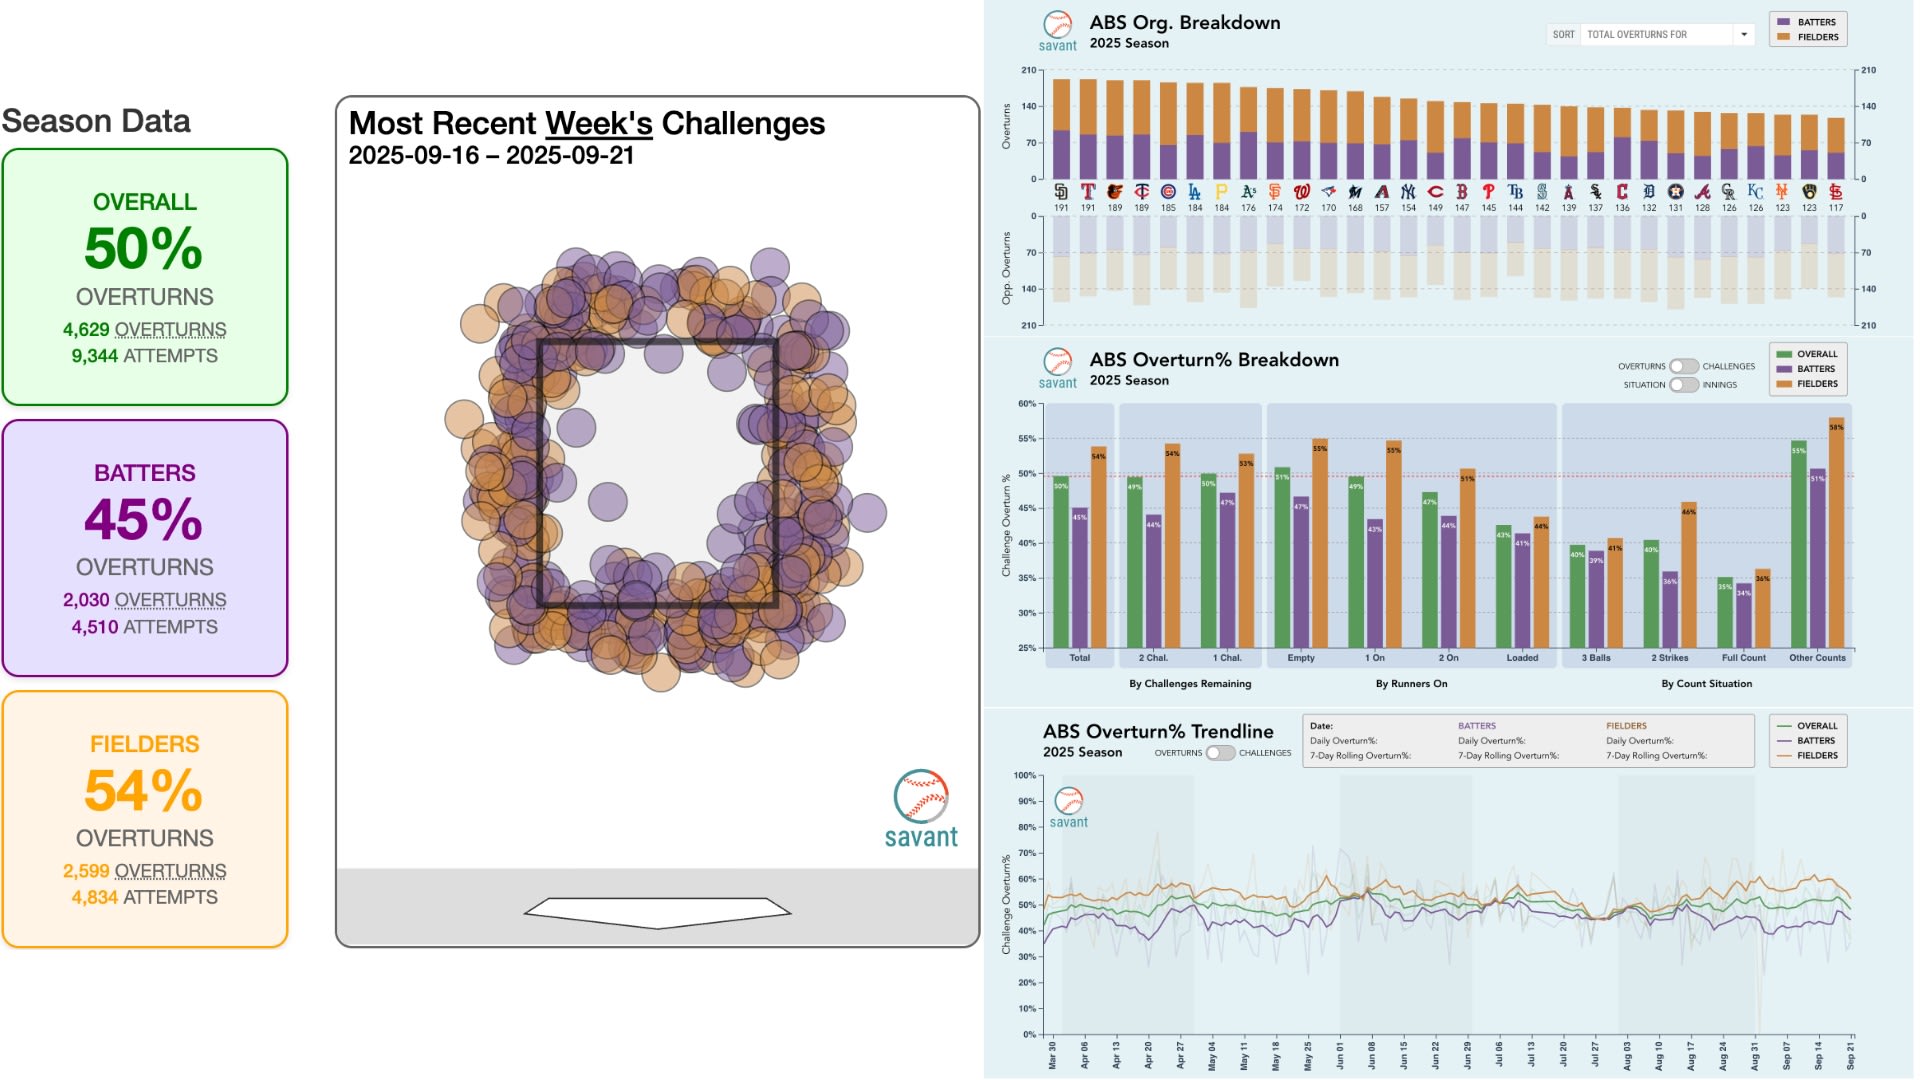
On the ABS dashboard, you'll find:
- A summary of the season's challenges and overturn rates for the league overall, batters and fielders
- Zone charts showing the pitch locations for the most recent day's and week's challenges
- Visuals breaking down challenges by organization, inning and game situation, plus league-wide challenge trends
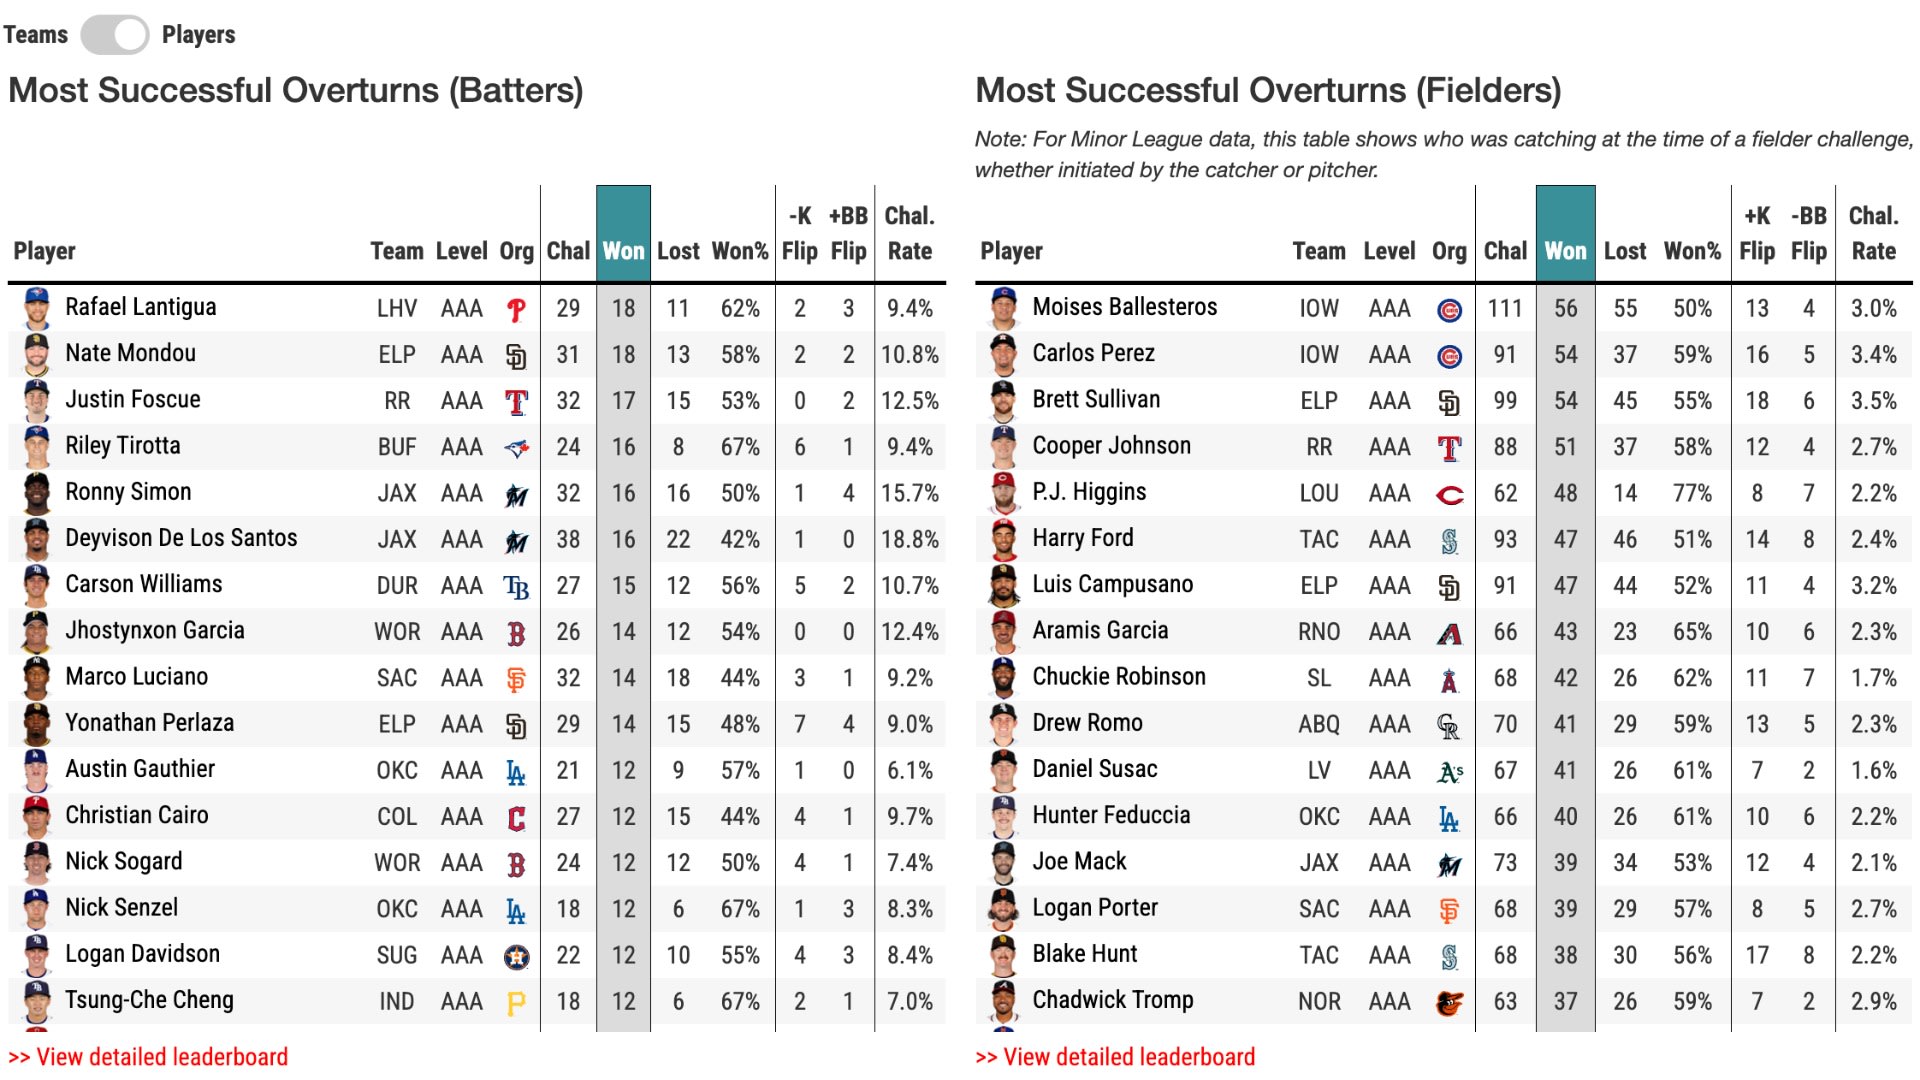
- Top challenge performers (player and team) for the current season, with basic challenge stats: total challenges, challenges won and lost, challenge win percentage, K and BB "flips" (challenges that create or erase a strikeout or walk), and challenge rate
On the ABS leaderboard, you'll find:
- All the basic challenge stats that are shown in the dashboard for batters and fielders
- Statcast challenge stats, centered on Overturns vs. Expected (a player's challenges won compared to what you would expect for an average player who faced/caught the exact same pitches)
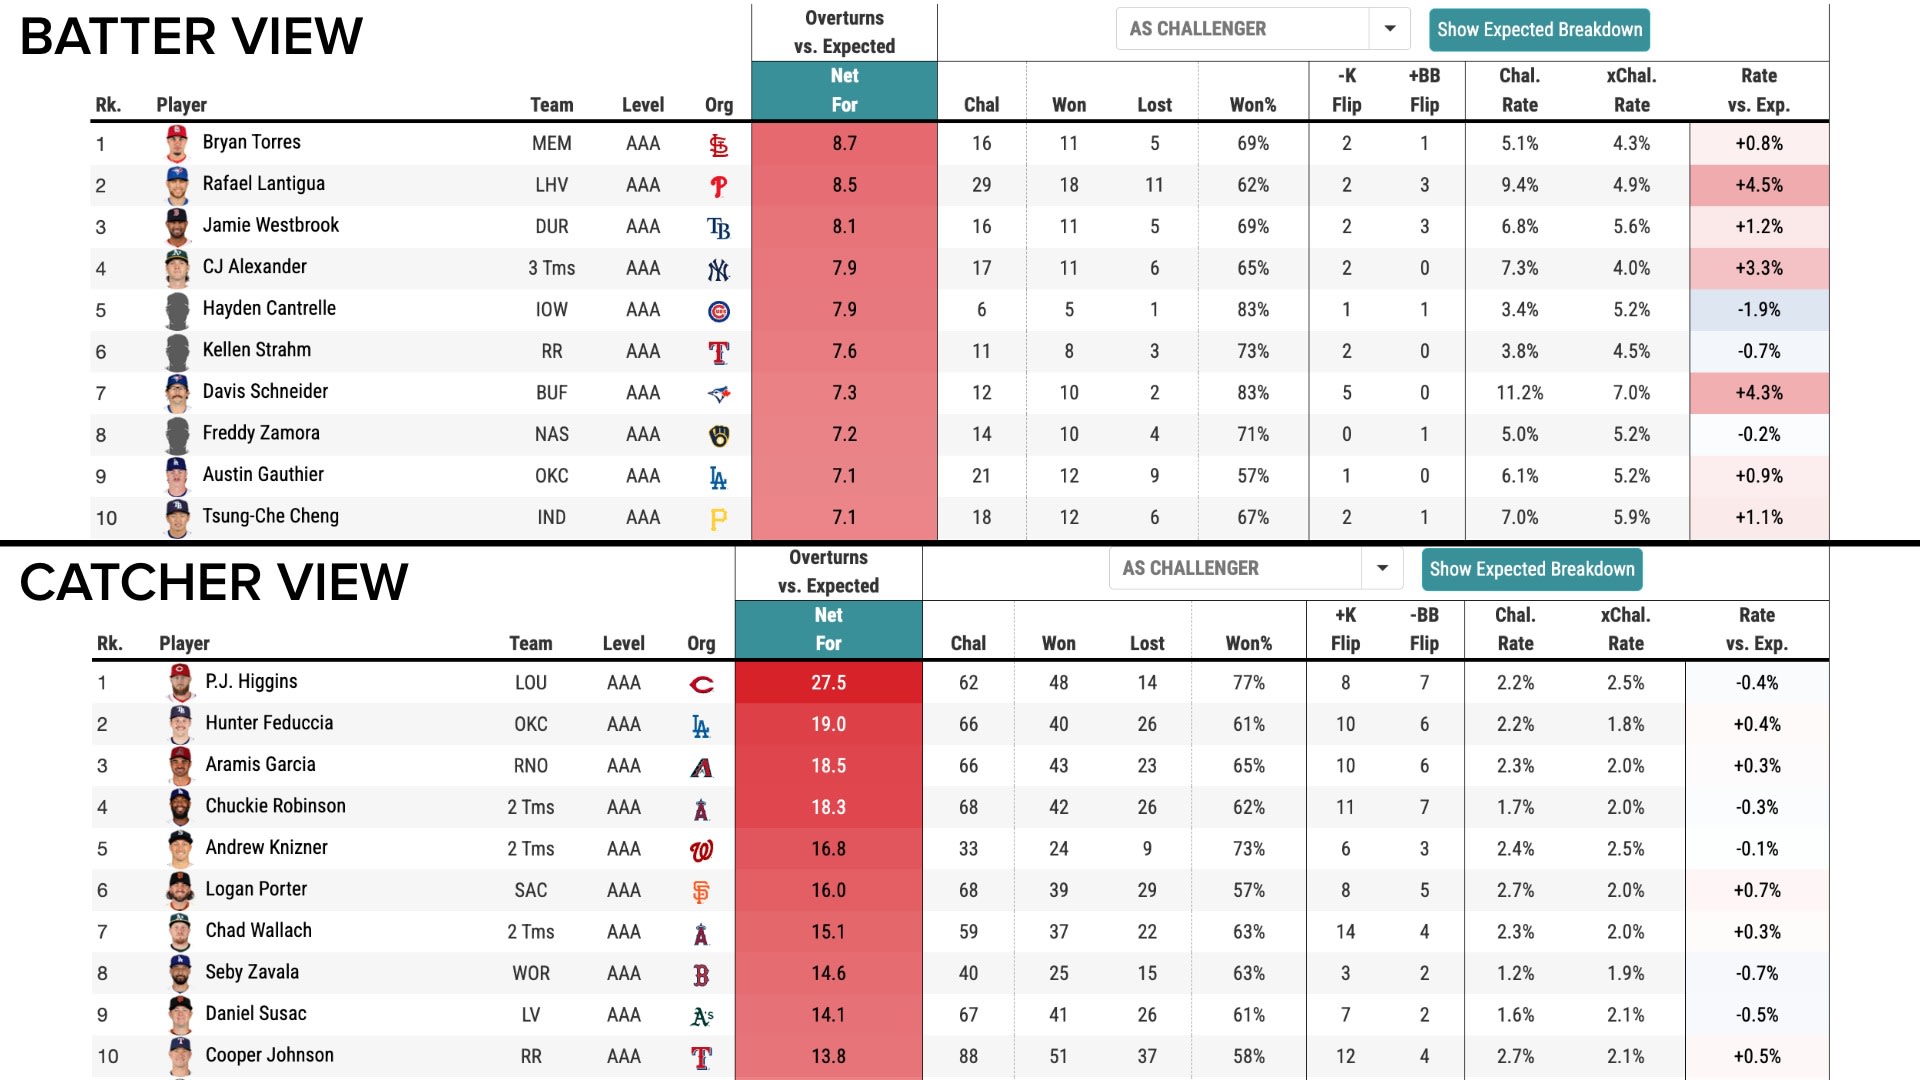
- A full breakdown of expected challenge metrics -- which show how likely a challenge is based on a model that includes pitch location, number of challenges remaining and the game situation (runners on base and balls/strikes/outs) -- and players' actual challenge stats vs. expected
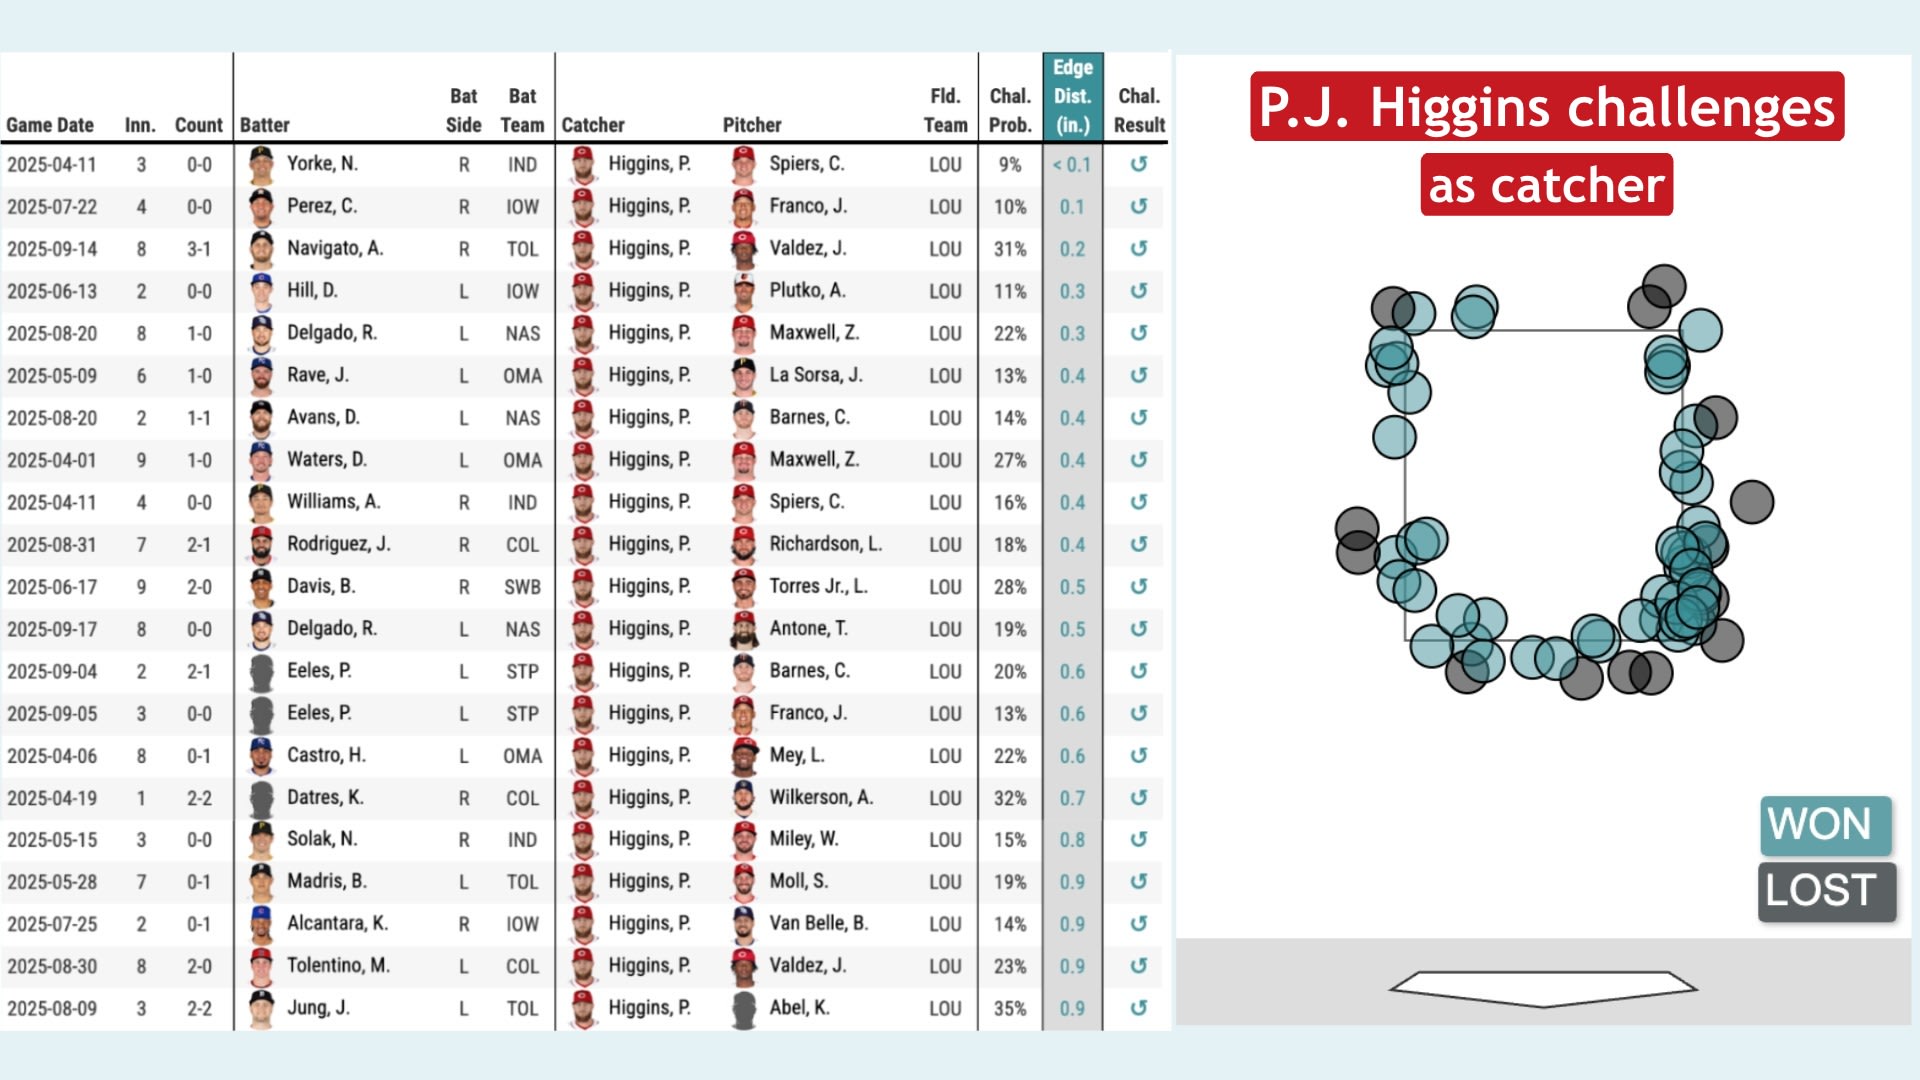
- Strike zone visuals showing the pitch locations for every player's individual challenges, plus a summary of those challenges with data showing each challenged pitch's distance from the edge of the strike zone and the challenge probability for that pitch
All stats and visuals are available for when the player is the challenger, and when the player is challenged against.