savant
illustrator
Gamefeed
Scoreboard
Probable Pitchers
Daily Matchups
Search
Visuals
Statistics
Statcast Statistics
Player Batting
2020
|
2019
|
2018
|
2017
|
2016
|
2015
|
All
Player Pitching
2020
|
2019
|
2018
|
2017
|
2016
|
2015
|
All
League Batting
2020
|
2019
|
2018
|
2017
|
2016
|
2015
League Pitching
2020
|
2019
|
2018
|
2017
|
2016
|
2015
Leaderboards
Leaderboards
Batting
Exit Velocity & Barrels
Expected Statistics
Rolling Windows
Percentile Rankings
Swing/Take
Pitch Arsenal Stats
Home Runs
Year to Year Changes
Pitching
Exit Velocity & Barrels
Expected Statistics
Pitch Arsenals
Pitch Arsenal Stats
Pitch Movement
Active Spin
Percentile Rankings
Swing/Take
Home Runs
Year to Year Changes
Spin Direction
Fielding
Outs Above Average
Outfield Directional OAA
Outfield Jump
Outfield Catch Probability
Catcher Poptime
Catcher Framing
Running
Sprint Speed
90ft Splits
Fielder Positioning
Fielder - Situational
Fielder - All
Team Positioning
Batter Positioning
Pitcher Positioning
Custom Leaderboard
Top Performers
Applications
Player Comparison Tool
Pitcher Visualization Report
Pitcher Arsenals
Sprint Speed Scroller
Player Positioning
League Statcast Stats
3D Pitch Visualizations
Visuals
Hit Probability Breakdown
Catch Probability Breakdown
Statcast Field Visualizer
Instant Replay Database
HR Derby
Draft Tracker
Savant Games
Player Similarity Scores
Saved Statcast Searches
Catcher Framing Leaderboard
Current: Catcher Framing
▾
Top Performers
Custom Leaderboards
Exit Velocity & Barrels
Expected Statistics
Rolling Windows
Swing & Take
Percentile Rankings
Pitch Arsenal Stats
Home Runs
Year to Year Changes
Exit Velocity & Barrels
Expected Statistics
Pitch Arsenals
Pitch Arsenal Stats
Pitch Movement
Active Spin
Swing & Take
Percentile Rankings
Home Runs
Year to Year Changes
Spin Direction - Comparison
Spin Direction - Pitches
Outs Above Average
Outfield Directional OAA
Outfield Catch Probability
Outfielder Jump
Poptime
Catcher Framing
Sprint Speed
90ft Running Splits
Fielder - Situational
Fielder - All
Team Positioning
Batter Positioning
Pitcher Positioning
Catcher framing
is the art of a catcher receiving a pitch in a way that makes it more likely for an umpire to call it a strike. 
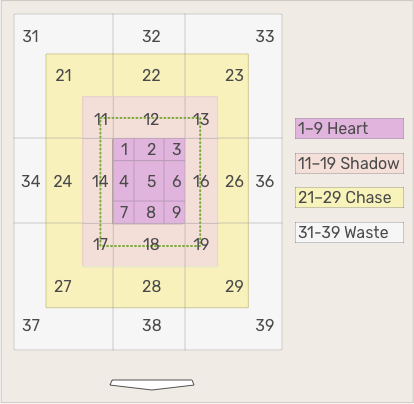
This page breaks down the catcher’s view into eight zones around the strike zone and shows the called strike percentage of all non-swings in that zone.
Strike Rate
shows the cumulative total of all zones.
Runs From Extra Strikes
converts strikes to runs saved
on a .125 run/strike basis
, and includes
park and pitcher adjustments
. To qualify, a catcher must receive 6 called pitches per team game.
How to say it:
“In 2018, Jeff Mathis converted 55 percent of non-swing pitches into called strikes in the
Shadow Zone
, the best rate of any catcher in baseball.”
Qualifier:
6 called pitches (i.e., takes, or non-swings) in the ‘shadow zone’ per team game. (The shadow zone is essentially the edges of the strike zone, roughly one ball width inside and one ball wide outside of the zone.
See what that looks like here
.)
Team
▾
Angels
Astros
Athletics
Blue Jays
Braves
Brewers
Cardinals
Cubs
D-backs
Dodgers
Giants
Indians
Mariners
Marlins
Mets
Nationals
Orioles
Padres
Phillies
Pirates
Rangers
Rays
Red Sox
Reds
Rockies
Royals
Tigers
Twins
White Sox
Yankees
2020
▾
2020
2019
2018
2017
2016
2015
Min Called Pitches: (Q)
▾
Qualified
100
250
500
750
1000
1250
1500
Update
Download CSV
Toggle League Average
Rk.
Catcher
Team
Pitches
Runs Extra Strikes
Strike Rate
Zone 11
Zone 12
Zone 13
Zone 14
Zone 16
Zone 17
Zone 18
Zone 19
League Average
145542
0
48.5%
20.5%
47.0%
21.7%
65.4%
66.5%
33.2%
49.5%
25.8%
Narvaez, Omar
965
5
53.7%
28.4%
54.1%
16.9%
66.9%
68.8%
44.7%
55.2%
39.0%
Caratini, Victor
611
2
53.0%
13.9%
59.5%
34.8%
63.5%
66.2%
48.5%
57.0%
24.2%
Barnes, Austin
932
2
52.8%
20.4%
46.3%
16.7%
58.1%
73.8%
36.4%
64.4%
42.9%
Realmuto, J.T.
973
3
51.9%
23.9%
36.7%
17.1%
76.6%
66.8%
48.1%
50.2%
29.8%
Vogt, Stephen
600
1
51.7%
37.5%
34.9%
26.7%
57.1%
69.0%
31.6%
60.9%
36.4%
Nola, Austin
1442
2
51.6%
14.3%
40.5%
23.8%
59.7%
67.5%
33.0%
67.3%
40.4%
Jeffers, Ryan
581
1
51.6%
21.2%
34.5%
9.1%
72.8%
62.5%
39.2%
58.3%
38.7%
McCann, James
814
2
51.4%
5.0%
35.6%
22.5%
61.6%
75.5%
38.1%
61.8%
31.3%
Perez, Roberto
857
2
51.3%
6.3%
50.4%
18.4%
66.7%
71.7%
32.6%
53.7%
32.7%
Contreras, Willson
1089
2
51.2%
17.9%
49.1%
29.1%
66.3%
68.5%
38.2%
53.0%
28.8%
Vazquez, Christian
1240
3
50.9%
24.8%
50.8%
32.3%
68.5%
67.7%
25.4%
53.6%
25.2%
Murphy, John Ryan
533
0
50.7%
11.9%
40.0%
20.0%
67.9%
67.8%
25.0%
62.2%
40.4%
Grandal, Yasmani
1078
3
50.6%
27.8%
50.4%
18.4%
62.4%
68.8%
38.2%
57.6%
29.2%
Casali, Curt
719
1
50.5%
15.3%
43.6%
26.2%
64.7%
69.2%
39.4%
60.9%
33.3%
Barnhart, Tucker
992
1
50.4%
18.6%
43.6%
18.4%
70.2%
67.2%
33.3%
63.0%
26.6%
Stassi, Max
784
1
50.3%
16.1%
50.0%
26.3%
58.5%
73.2%
32.9%
57.9%
34.2%
Molina, Yadier
1281
2
50.3%
14.4%
45.0%
10.3%
64.5%
74.3%
39.2%
59.7%
29.7%
Castro, Jason
718
0
50.1%
30.5%
50.0%
16.3%
55.9%
67.5%
47.6%
54.9%
30.9%
Higashioka, Kyle
455
1
50.1%
17.6%
31.6%
18.8%
81.0%
71.7%
33.3%
54.1%
31.4%
Heineman, Tyler
408
0
50.0%
7.4%
41.0%
30.4%
71.2%
63.8%
46.7%
57.3%
18.8%
Tromp, Chadwick
540
1
50.0%
19.5%
37.7%
16.7%
69.8%
62.8%
36.2%
56.3%
37.2%
Leon, Sandy
648
0
49.8%
15.4%
53.0%
27.1%
59.1%
67.2%
47.2%
60.3%
25.0%
Kelly, Carson
1064
1
49.5%
20.7%
42.0%
23.3%
71.4%
64.2%
39.4%
52.9%
22.0%
Nottingham, Jacob
497
1
49.5%
12.9%
40.9%
26.3%
66.7%
67.5%
35.4%
55.9%
25.0%
Hedges, Austin
739
0
49.4%
22.6%
44.7%
25.4%
59.6%
67.9%
29.7%
55.6%
32.6%
Mathis, Jeff
689
1
49.3%
21.7%
54.1%
21.7%
62.7%
68.5%
32.7%
52.6%
24.3%
Murphy, Sean
1359
3
49.3%
20.5%
43.2%
10.0%
67.9%
67.1%
26.0%
56.6%
24.3%
Trevino, Jose
567
0
49.0%
19.0%
48.7%
28.0%
68.8%
58.9%
51.9%
53.3%
21.7%
Perez, Salvador
998
0
49.0%
17.7%
44.6%
17.5%
76.1%
71.5%
37.7%
44.6%
26.6%
Flowers, Tyler
600
1
49.0%
22.4%
50.8%
34.6%
63.4%
67.2%
33.3%
54.9%
21.7%
Bart, Joey
845
0
49.0%
24.0%
36.7%
25.0%
62.1%
69.3%
40.0%
51.8%
37.2%
d'Arnaud, Travis
1408
1
48.9%
19.2%
51.6%
30.6%
65.8%
66.2%
29.4%
48.4%
19.2%
Gallagher, Cam
544
-1
48.9%
15.2%
40.6%
9.5%
67.6%
56.5%
40.0%
67.2%
23.7%
Stallings, Jacob
1225
2
48.5%
13.3%
35.7%
23.7%
60.1%
65.8%
29.5%
60.2%
33.8%
Bemboom, Anthony
500
2
48.4%
29.3%
36.7%
12.5%
64.5%
67.1%
35.6%
50.0%
30.8%
Garneau, Dustin
426
0
47.9%
25.0%
41.5%
30.4%
78.9%
63.5%
42.9%
47.9%
10.8%
Maldonado, Martin
1828
-2
47.8%
19.0%
47.4%
23.8%
64.1%
68.2%
24.7%
54.1%
22.0%
Sanchez, Gary
1152
-2
47.6%
12.8%
32.1%
14.9%
64.5%
67.5%
24.0%
52.2%
43.6%
Cervelli, Francisco
443
0
47.6%
23.8%
42.6%
6.3%
70.1%
66.7%
27.6%
45.8%
15.0%
Wolters, Tony
1004
-1
47.2%
21.6%
47.6%
22.9%
63.8%
66.3%
41.2%
46.5%
14.8%
Diaz, Elias
451
0
47.2%
28.6%
33.3%
25.0%
76.7%
55.3%
32.5%
44.2%
20.0%
Avila, Alex
455
0
46.8%
23.3%
55.1%
22.7%
60.8%
61.3%
27.5%
51.5%
17.8%
Butera, Drew
440
0
46.8%
20.6%
40.5%
18.8%
68.9%
53.6%
44.0%
58.8%
17.2%
Chirinos, Robinson
783
-1
46.6%
23.0%
40.4%
20.8%
62.7%
70.4%
36.6%
39.9%
28.9%
Perez, Michael
729
-2
46.4%
18.6%
65.6%
25.0%
62.1%
56.6%
22.0%
45.9%
17.6%
Jansen, Danny
1281
-1
46.4%
18.0%
39.0%
17.9%
65.3%
68.1%
25.5%
45.9%
32.3%
Garver, Mitch
557
0
46.3%
14.6%
46.0%
18.5%
54.0%
59.1%
38.5%
54.0%
38.6%
Greiner, Grayson
489
-1
46.2%
34.2%
68.3%
24.0%
54.3%
61.0%
25.0%
41.2%
8.3%
Torrens, Luis
610
-2
46.1%
20.5%
46.9%
20.0%
63.4%
56.7%
37.7%
49.6%
19.0%
Romine, Austin
1068
-1
45.9%
10.3%
31.0%
18.4%
62.1%
67.7%
30.9%
47.7%
30.3%
Sisco, Chance
700
-3
45.9%
18.2%
31.6%
13.6%
68.8%
56.9%
32.7%
48.9%
20.9%
Wallach, Chad
520
-1
45.8%
17.9%
41.3%
14.3%
66.3%
60.2%
25.9%
56.3%
25.0%
Severino, Pedro
995
-4
45.7%
25.0%
38.4%
14.6%
64.4%
64.4%
33.8%
45.4%
28.5%
Zunino, Mike
1278
-5
45.1%
17.3%
49.0%
25.6%
59.7%
65.1%
22.5%
44.4%
20.3%
Knapp, Andrew
600
-1
45.0%
18.9%
42.4%
18.8%
59.7%
52.5%
41.2%
52.2%
24.7%
Gomes, Yan
885
-3
44.9%
20.7%
37.4%
16.7%
67.3%
60.7%
37.9%
45.7%
16.3%
Ramos, Wilson
1112
0
44.8%
24.8%
58.7%
27.4%
66.2%
63.5%
22.8%
29.6%
15.8%
Smith, Will
1125
-5
44.1%
13.5%
51.9%
23.3%
62.7%
62.6%
32.3%
45.8%
22.7%
Suzuki, Kurt
875
-4
43.9%
23.5%
31.9%
12.5%
63.7%
64.3%
35.6%
44.0%
17.3%
Odom, Joseph
459
-1
43.8%
14.3%
54.8%
27.8%
54.3%
55.6%
15.6%
49.5%
30.4%
Plawecki, Kevin
598
-3
43.0%
19.3%
49.4%
13.3%
60.7%
59.3%
31.6%
41.6%
19.7%
Alfaro, Jorge
746
-3
41.3%
16.9%
46.3%
18.6%
58.2%
55.8%
16.7%
44.8%
16.9%