savant
illustrator
Gamefeed
Scoreboard
Probable Pitchers
Daily Matchups
Search
Visuals
Statistics
Statcast Statistics
Player Batting
2020
|
2019
|
2018
|
2017
|
2016
|
2015
|
All
Player Pitching
2020
|
2019
|
2018
|
2017
|
2016
|
2015
|
All
League Batting
2020
|
2019
|
2018
|
2017
|
2016
|
2015
League Pitching
2020
|
2019
|
2018
|
2017
|
2016
|
2015
Leaderboards
Leaderboards
Batting
Exit Velocity & Barrels
Expected Statistics
Rolling Windows
Percentile Rankings
Swing/Take
Pitch Arsenal Stats
Home Runs
Year to Year Changes
Pitching
Exit Velocity & Barrels
Expected Statistics
Pitch Arsenals
Pitch Arsenal Stats
Pitch Movement
Active Spin
Percentile Rankings
Swing/Take
Home Runs
Year to Year Changes
Spin Direction
Fielding
Outs Above Average
Outfield Directional OAA
Outfield Jump
Outfield Catch Probability
Catcher Poptime
Catcher Framing
Running
Sprint Speed
90ft Splits
Fielder Positioning
Fielder - Situational
Fielder - All
Team Positioning
Batter Positioning
Pitcher Positioning
Custom Leaderboard
Top Performers
Applications
Player Comparison Tool
Pitcher Visualization Report
Pitcher Arsenals
Sprint Speed Scroller
Player Positioning
League Statcast Stats
3D Pitch Visualizations
Visuals
Hit Probability Breakdown
Catch Probability Breakdown
Statcast Field Visualizer
Instant Replay Database
HR Derby
Draft Tracker
Savant Games
Player Similarity Scores
Enhanced Game Scores
Saved Statcast Searches
Statcast Outs Above Average
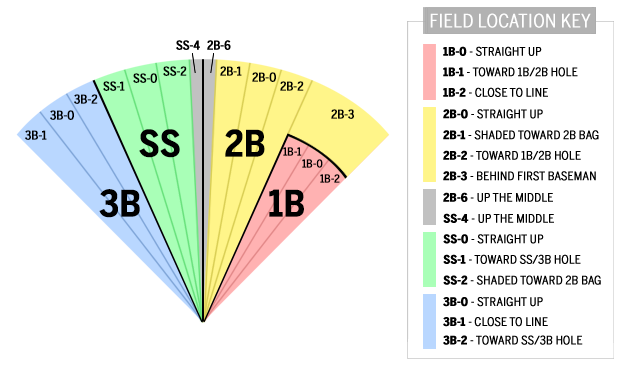
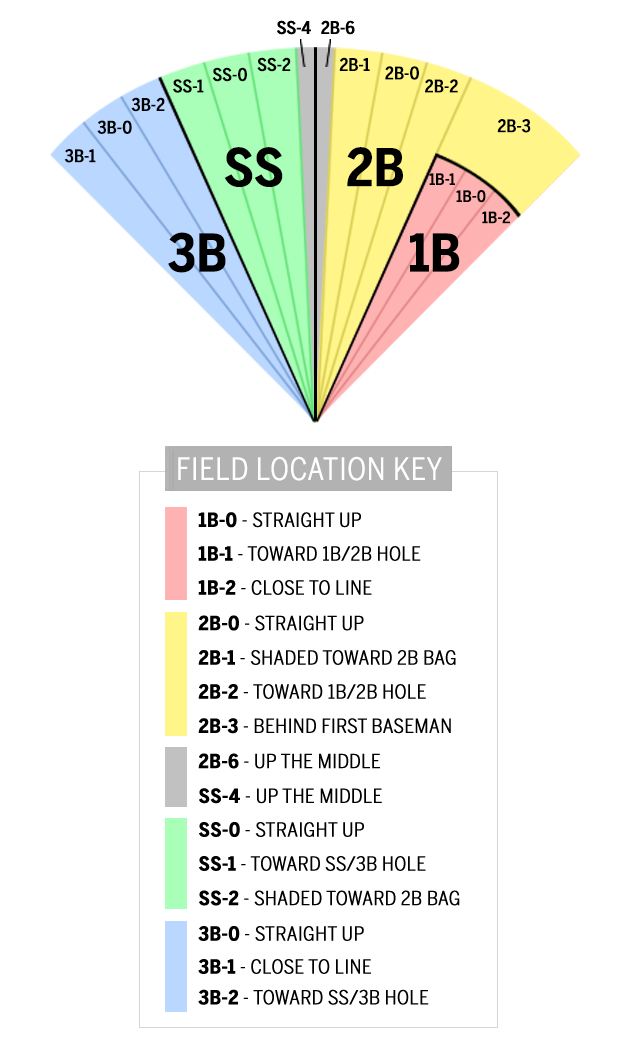
This page allows you to break down the
Outs Above Average
performance of infielders and outfielders both at their lineup position and at a location on the field. This can be done on a team or individual basis. For example, in 2019, Nolan Arenado was +17 OAA as a third baseman (the only position he played), but that breaks down into +14 at third base and +3 at shortstop. Field location positions may be expanded into more detailed breakdowns, like “close to the line,” or “up the middle.” Please click “toggle location key” to see the field location legend.
2020
▾
2020
2019
2018
2017
2016
ALL
View: Fielder
▾
View: Fielder
View: Batter
View: Pitcher
All Results
▾
All Results
Hits
Outs
Errors
Detailed Fielder Roles
▾
Select Roles:
X
1B
Toggle All
Close to Line
Straight Up
Toward 1B/2B Hole
LF
Toggle All
Close to Line
Leaning Left
Straight Up
Leaning Right
LF Gap
2B
Toggle All
Behind First Baseman
Toward 1B/2B Hole
Straight Up
Shaded Toward 2B Bag
Up the Middle
CF
Toggle All
LF Gap
Leaning Left
Leaning Right
RF Gap
SS
Toggle All
Up the Middle
Shaded Toward 2B Bag
Straight Up
Toward 3B/SS Hole
RF
Toggle All
LF Gap
Leaning Left
Straight Up
Leaning Right
Close to Line
3B
Toggle All
Close to Line
Straight Up
Toward 3B/SS Hole
Direction
▾
Direction
In
Lateral-3B
Lateral-1B
Back
Batside
▾
Batside
RHB
LHB
Est. Success Rate >=
Est. Success Rate <=
Distance >=
Distance <=
Exit Velocity >=
Exit Velocity <=
Clear
Box Plots - Starting Position
▾
Box Plots - Starting Position
Box Plots - Ending Position
Save Visual
View Player Page
Toggle Location Key